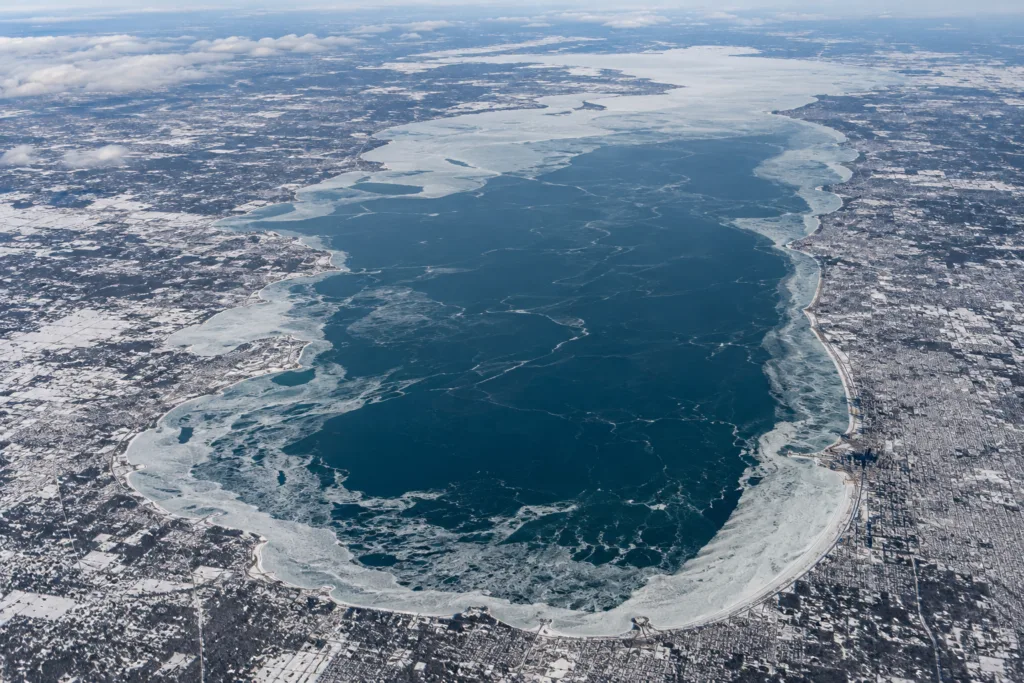
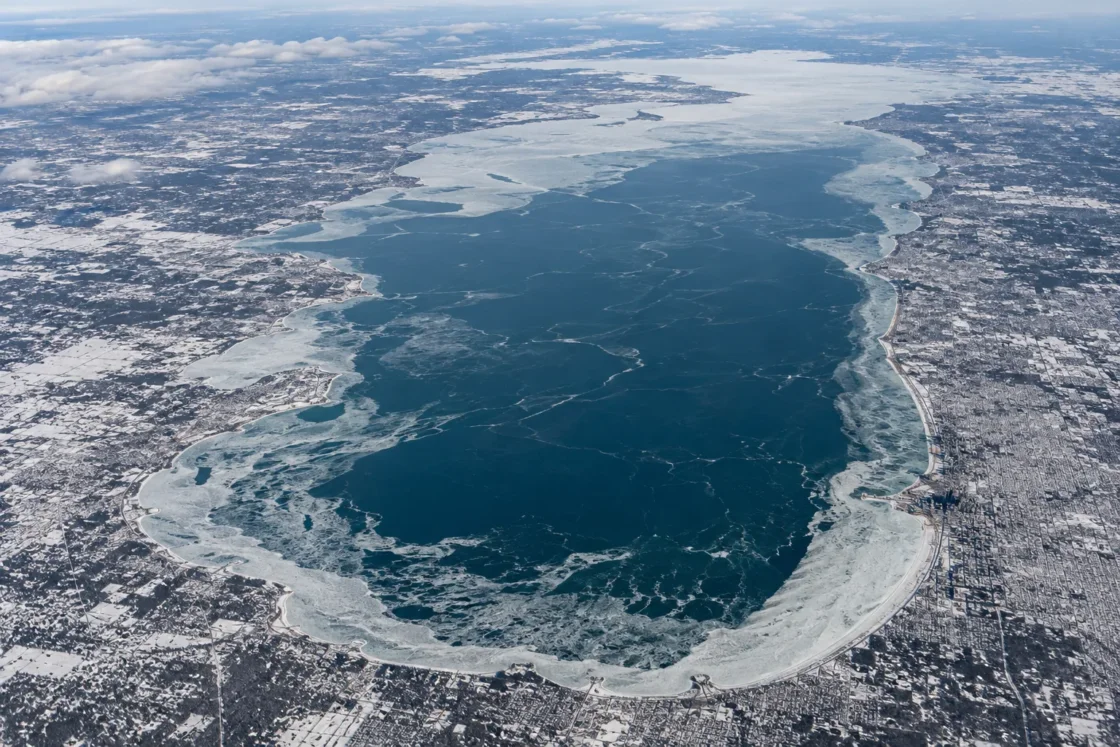
Seasonal ice cover is common, but Lake Michigan usually remains partly open.
Official MonitoringNOAA Great Lakes Environmental Research Laboratory — Great Lakes Ice CoverNOAA GLERL — Annual Maximum Ice Cover by LakeNOAA GLERL — Annual Maximum Ice Cover by Lake with DatesNOAA Climate.gov — Great Lakes Ice Cover Decreasing over the Last 40 YearsNOAA GLERL — Great Lakes Ice Cover Near Average for the 2025 SeasonU.S. EPA — Physical Features of the Great LakesEvidence: HighLake Michigan's relatively deep basin cools gradually and stores heat into winter, limiting continuous lake-wide ice while shallower and nearshore waters can freeze more extensively.
Where Is Lake Michigan?
Michigan, Wisconsin, Illinois, Indiana · United States
Lake Michigan on the Globe
Rotate the world or focus directly on the lake.
Measured Ice and Freeze Data
Evidence Behind the Freeze Profile
NOAA's standardized Lake Michigan series from 1973 through 2026 never reaches 100% annual maximum ice cover.
Official MonitoringNOAA GLERL — Annual Maximum Ice Cover by LakeEvidence: HighNOAA Climate.gov reports that the middle of Lake Michigan is, on average, 80–90% ice-free at winter maximum.
Official Climate AnalysisNOAA Climate.gov — Great Lakes Ice Cover Decreasing over the Last 40 YearsEvidence: HighNOAA GLERL explains that Lake Michigan's relatively deep basin warms and cools more slowly than shallow Lake Erie, producing more gradual ice development and lower overall cover.
Official Seasonal AnalysisNOAA GLERL — Great Lakes Ice Cover Near Average for the 2025 SeasonU.S. EPA — Physical Features of the Great LakesEvidence: HighThe NOAA annual-maximum series spans winters with very low coverage and winters with more than nine-tenths of the lake surface covered.
Official MonitoringNOAA GLERL — Annual Maximum Ice Cover by LakeEvidence: HighSources
- NOAA Great Lakes Environmental Research Laboratory — Great Lakes Ice Cover
- NOAA GLERL — Annual Maximum Ice Cover by Lake
- NOAA GLERL — Annual Maximum Ice Cover by Lake with Dates
- NOAA Climate.gov — Great Lakes Ice Cover Decreasing over the Last 40 Years
- NOAA GLERL — Great Lakes Ice Cover Near Average for the 2025 Season
- U.S. EPA — Physical Features of the Great Lakes
- Wikidata — Lake Michigan (GNIS-referenced location)
Lake Michigan forms winter ice every year, but a continuous shore-to-shore sheet is not its normal state. Its winter surface is usually a mix of ice and open water, with the deepest open-lake areas resisting freeze longer than shallower water closer to shore.
Why the center of Lake Michigan stays open so often
Lake Michigan is deep enough to carry a large store of heat into winter. Its average depth is about 85 meters, and the deep basin cools more slowly than a shallow lake exposed to the same cold air. That stored heat must be removed before broad, stable ice can develop.
Wind and wave action also keep the open lake mixed. Cold spells can expand ice quickly, but a large exposed surface does not behave like a sheltered pond. This is why extensive shoreline ice can exist at the same time as large open-water areas farther offshore.
Ice cover is not evenly distributed across the lake
A single lake-wide percentage hides strong spatial differences. Shallow water, protected bays, harbor areas and nearshore zones can freeze earlier and carry denser ice while the central basin remains much more open. NOAA’s long-term climate description of Lake Michigan reflects this contrast: the middle of the lake remains mostly ice-free on average even around the winter maximum.
This spatial pattern also explains why a photograph of a frozen shoreline cannot be treated as evidence that Lake Michigan has frozen over. Local ice conditions describe one part of a very large water body, not the whole surface.
Near-total ice years are different from a complete freeze
Lake Michigan has had winters when ice spread across more than nine-tenths of its surface, but NOAA’s modern annual-maximum record does not show a 100% lake-wide maximum. The distinction matters: a winter can look almost completely frozen on a basin-scale ice chart while still retaining open leads, offshore water or moving ice fields.
The opposite extreme also occurs. Mild winters can leave most of the lake open, so the difference between low-ice and high-ice years is unusually large. Air temperature is a major control, but the response is filtered through the lake’s depth, stored heat, wind and mixing.
What an annual maximum ice percentage actually measures
NOAA’s annual maximum is the largest percentage of Lake Michigan’s surface classified as ice-covered on a day during that winter season. It is not the seasonal average, and it is not an ice-thickness measurement. A high annual maximum can result from a relatively short cold period even if the rest of the winter carries much less ice.
The date of maximum cover also moves from year to year. February is the most common peak month in the NOAA series, but some winters reach their maximum in January or March. That variability is one reason a fixed calendar date is a poor description of Lake Michigan’s freeze cycle.
Why “Lake Michigan freezes” needs a precise meaning
For Lake Michigan, “freezes” is best understood as seasonal ice formation rather than routine total freeze-over. Ice can become extensive, especially during sustained cold, yet large portions of the lake may remain open. Lake-wide ice concentration, local shore ice and a true complete freeze are separate conditions and should not be used interchangeably.
Similar Lakes by Freeze Pattern
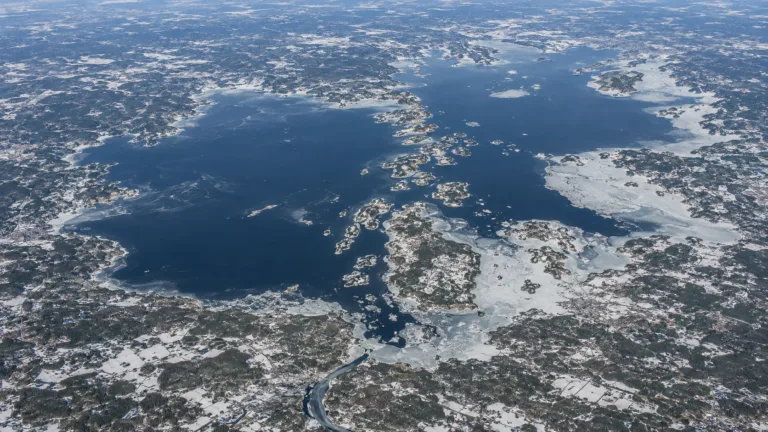
Lake Vänern Freeze
Usually Partially Freezes
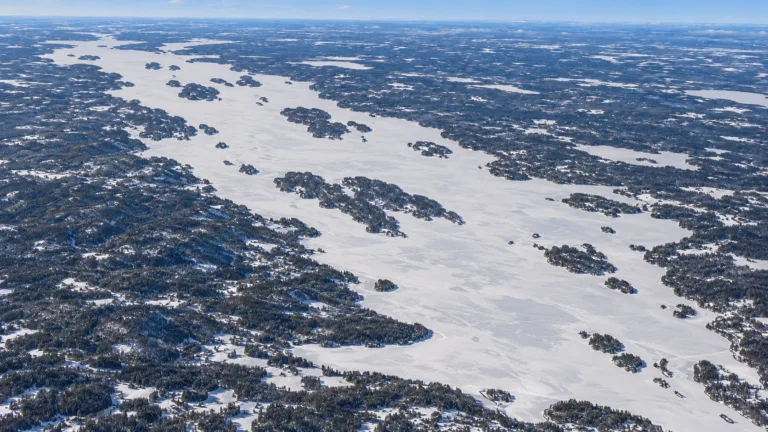
Lake Pielinen Freeze
Usually Fully Freezes
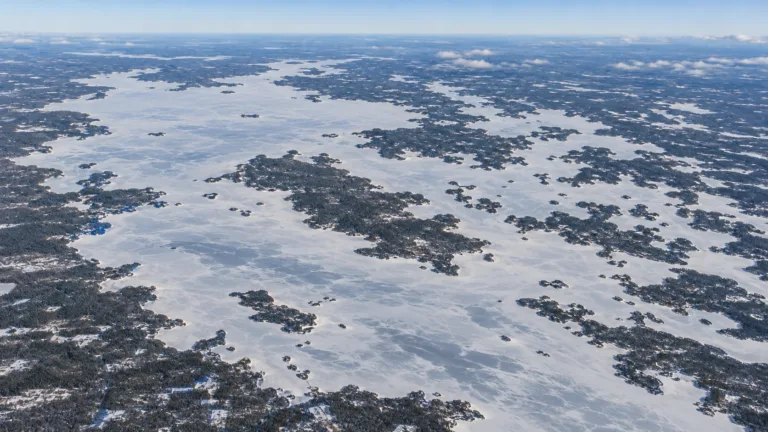
Lake Oulujärvi Freeze
Usually Fully Freezes
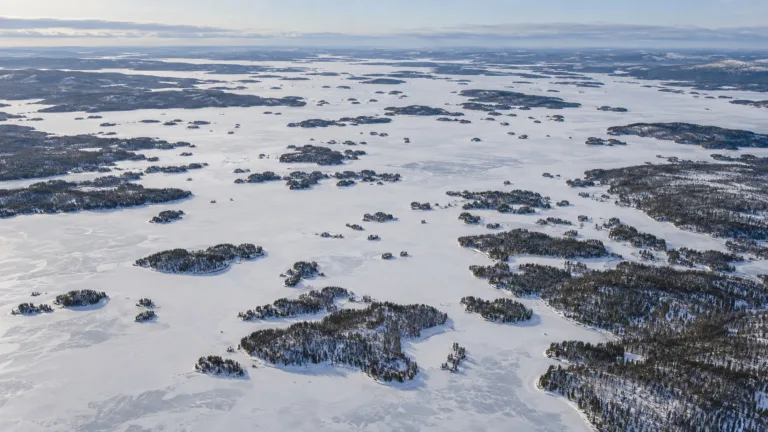
Lake Inari Freeze
Usually Fully Freezes
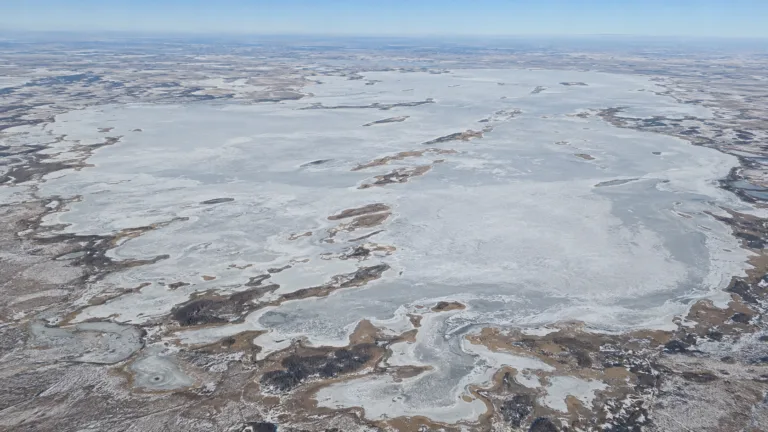
Lake Chany Freeze
Usually Fully Freezes

Lake Teletskoye Freeze
Variable Full/Partial Freeze