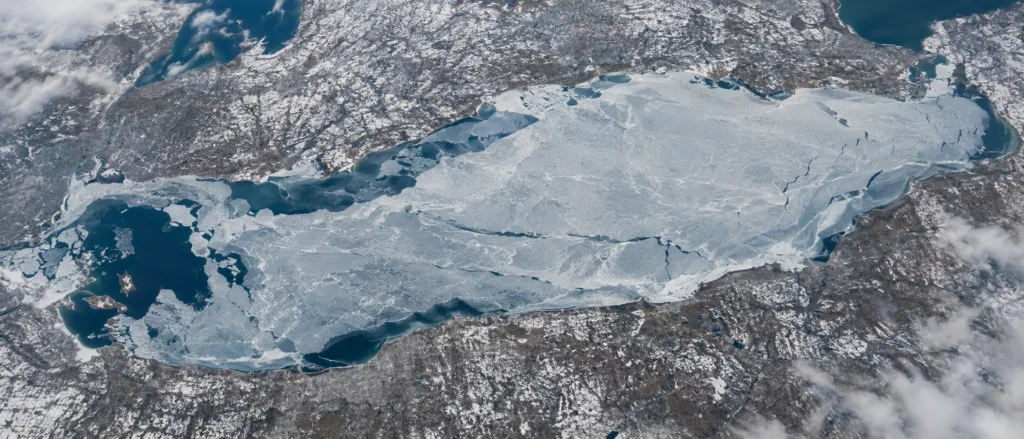
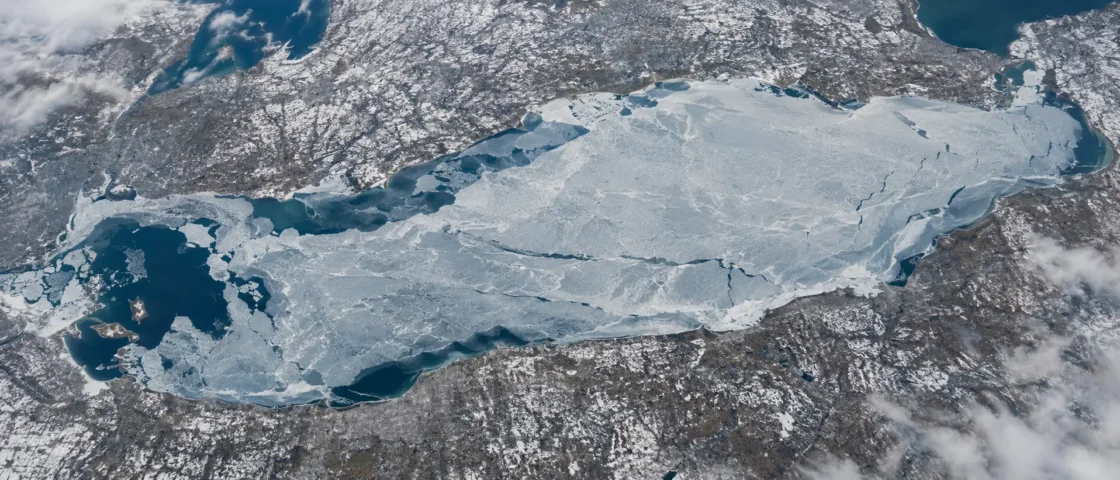
Extensive seasonal ice with strong year-to-year variability
Official Monitoring and Government Lake DataNOAA Great Lakes Environmental Research Laboratory — Great Lakes Ice CoverNOAA CoastWatch Great Lakes — Lake Erie Long-Term Average Ice ConcentrationNOAA GLERL — An Ice Cover Climatology for Lake Erie and Lake SuperiorU.S. Environmental Protection Agency — Lake ErieEvidence: HighLake Erie stores less winter heat than the deeper Great Lakes. Its shallow western basin cools and freezes earliest, while deeper central and eastern waters and wind-exposed areas can remain more variable.
Where Is Lake Erie?
Canada / United States
Lake Erie on the Globe
Rotate the world or focus directly on the lake.
Measured Ice and Freeze Data
Freeze and Ice Cover Through the Year
Month-level states are shown only when supported. Unclassified months remain explicitly marked.
Evidence Behind the Freeze Profile
NOAA monitoring documents broad seasonal ice cover and large annual maxima, while EPA identifies the lake's shallow depth as a reason it cools rapidly in winter.
Official Monitoring and Government Lake DataNOAA Great Lakes Environmental Research Laboratory — Great Lakes Ice CoverNOAA GLERL — Annual Maximum Ice Cover by Lake with DatesU.S. Environmental Protection Agency — Lake ErieEvidence: HighNOAA climatology describes ice forming first along shorelines and in the western basin before progressing toward the central and eastern basins.
Historical Ice ClimatologyNOAA GLERL — An Ice Cover Climatology for Lake Erie and Lake SuperiorEvidence: HighThe NOAA annual-maximum record reaches 100% in 1978, 1979 and 1996, while other winters produced far smaller maxima.
Official Historical Monitoring RecordNOAA GLERL — Annual Maximum Ice Cover by Lake with DatesEvidence: HighNOAA identifies mid- to late February as the normal maximum-ice period for the lower Great Lakes, including Lake Erie.
Official MonitoringNOAA Great Lakes Environmental Research Laboratory — Great Lakes Ice CoverNOAA CoastWatch Great Lakes — Lake Erie Long-Term Average Ice ConcentrationEvidence: HighSources
- NOAA Great Lakes Environmental Research Laboratory — Great Lakes Ice Cover
- NOAA GLERL — Annual Maximum Ice Cover by Lake with Dates
- NOAA CoastWatch Great Lakes — Lake Erie Long-Term Average Ice Concentration
- NOAA GLERL — An Ice Cover Climatology for Lake Erie and Lake Superior
- U.S. Environmental Protection Agency — Lake Erie
- Wikidata — Lake Erie Geographic Record
Lake Erie can develop broad winter ice faster than the deeper Great Lakes, but the lake does not behave as one uniform sheet. Its shallow western basin cools first, while deeper central and eastern waters and exposed mid-lake areas can remain more changeable as wind, waves and stored heat affect ice formation.
Why Lake Erie can build ice so quickly
Depth is central to Lake Erie’s winter behavior. The lake averages only about 19 metres deep, making it the shallowest of the Great Lakes. Its western basin is shallower still, averaging about 7.4 metres, compared with roughly 18.3 metres in the central basin and about 24 metres in the eastern basin.
A shallow water column stores less heat than a deep one. Once autumn cooling has removed the summer heat, prolonged subfreezing weather can therefore bring large areas of Lake Erie toward the freezing point comparatively quickly. This is why a strong cold spell can produce a rapid increase in lake-wide ice percentage rather than a slow, steady expansion throughout the entire winter.
The western basin freezes before the deeper lake
Historical NOAA ice climatology describes a clear west-to-east progression. Shoreline ice begins forming during December and January, with the shallow western basin developing ice first. Formation then advances toward the deeper central and eastern basins as winter cooling continues.
The difference is physical rather than merely geographic. The western basin has far less water above each square metre of lakebed than the eastern basin, so it can lose its stored heat sooner. The deeper eastern basin requires more cooling before comparable ice can develop.
Even during cold weather, the middle of the lake does not always hold continuous ice as readily as protected or shallow water. NOAA’s historical climatology notes that wind can delay ice formation or break up newly formed mid-lake ice, producing repeated episodes of formation and loss. A frozen bay, harbor or western-basin area therefore cannot be treated as proof that the entire lake has frozen over.
Complete coverage is possible, but winter outcomes vary widely
Lake Erie’s historical record shows why “Lake Erie freezes over” needs a precise definition. NOAA’s annual-maximum series recorded 100% ice cover in 1978, 1979 and 1996. At the opposite end of the record, the annual maximum reached only 5.4% in 1998.
Those values describe the greatest percentage of the lake surface covered by ice during each winter, not the average condition throughout the season. They also show that Lake Erie can move between almost complete coverage and very limited coverage depending on winter weather.
The 2026 season offers a recent high-ice example without being a substitute for climatology. Lake Erie reached a 96.0% annual maximum on February 5, 2026. That value belongs to one winter; it should not be read as the normal percentage expected every year.
Why the usual peak comes in February
Ice formation does not respond only to the temperature on a single cold day. The lake first has to lose heat accumulated during the warmer part of the year. NOAA’s long-running observations place the normal maximum-ice window for lower Great Lakes such as Erie between the middle and end of February.
The long-term Lake Erie curve reflects that seasonal lag. Ice begins building during early winter, expands rapidly during sustained cold periods, and then declines as late-winter and spring conditions add heat back to the lake. The exact peak date and percentage can shift sharply from one year to another.
What an ice-cover percentage does and does not describe
NOAA’s lake-wide percentage represents the share of Lake Erie’s surface classified as ice covered. The historical record combines Great Lakes ice products originating with the Canadian Ice Service and, from 1989 onward, the U.S. National Ice Center, with NOAA GLERL processing the data into a consistent long-term record.
Surface coverage is different from ice thickness. A reading of 90% means that ice is mapped across roughly nine-tenths of the lake surface; it does not mean that the ice has the same thickness, age or condition everywhere. Lake Erie’s large western-to-eastern depth difference, moving ice, cracks, open-water leads and wind-driven breakup can all produce local conditions that a single lake-wide percentage cannot describe.
Similar Lakes by Freeze Pattern
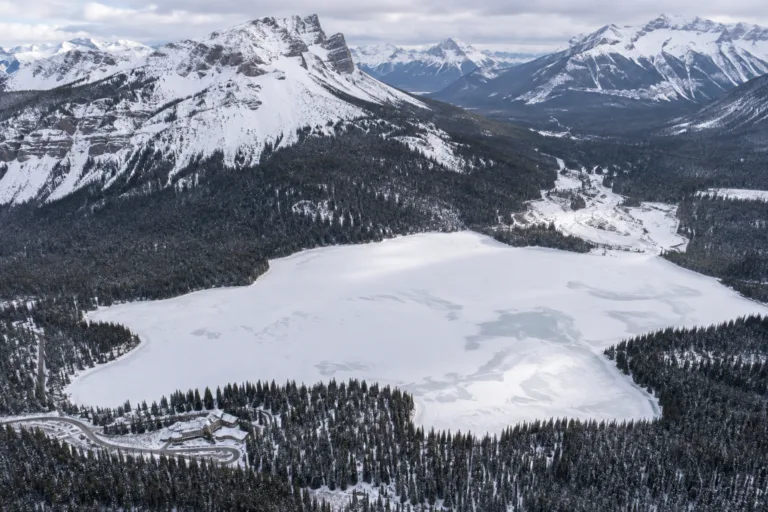
Emerald Lake Freeze
Usually Fully Freezes
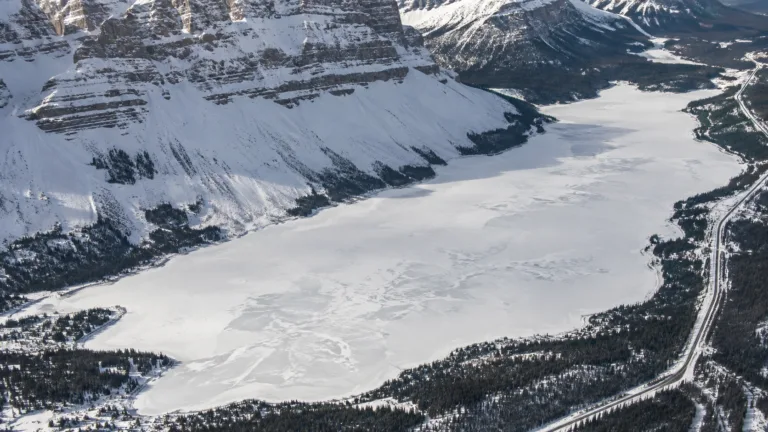
Bow Lake Freeze
Usually Fully Freezes
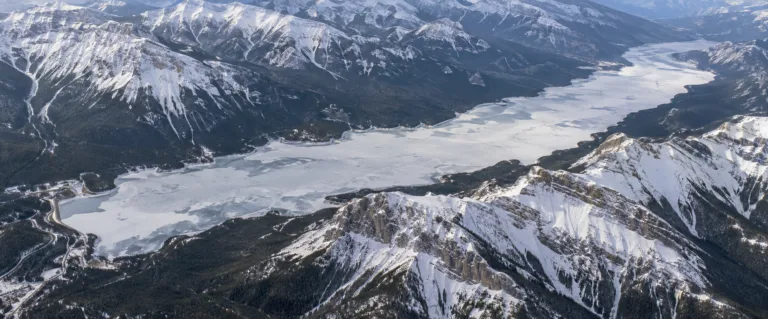
Lake Minnewanka Freeze
Usually Fully Freezes
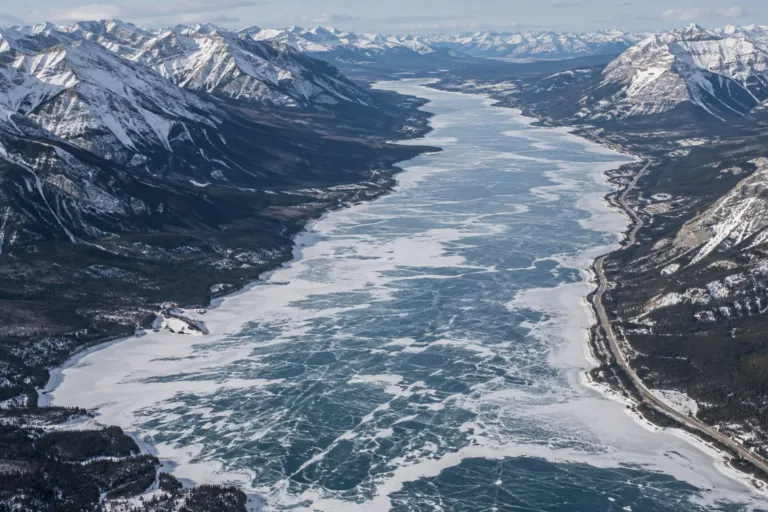
Abraham Lake Freeze
Usually Fully Freezes
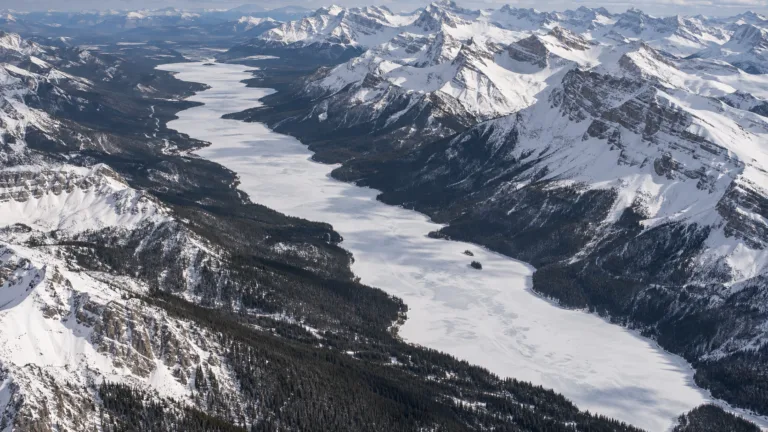
Maligne Lake Freeze
Usually Fully Freezes
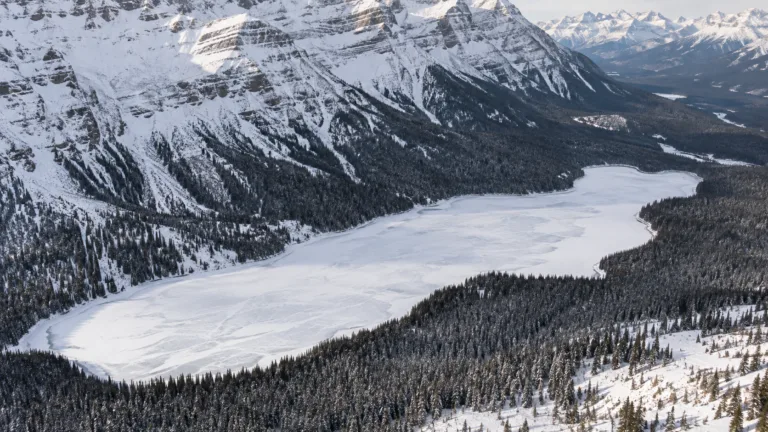
Peyto Lake Freeze
Usually Fully Freezes