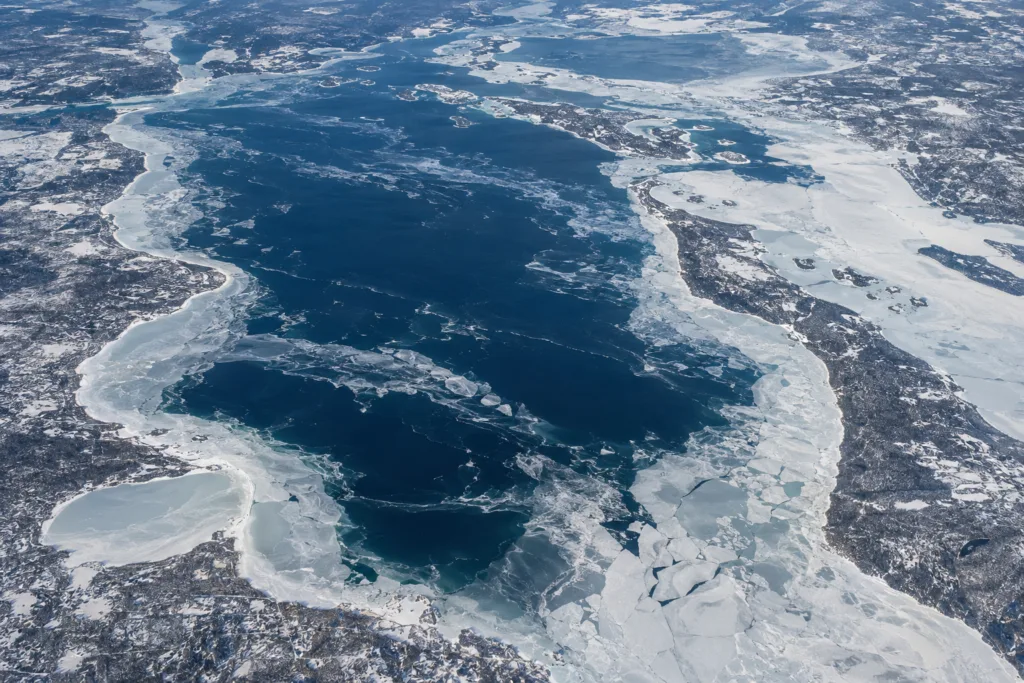
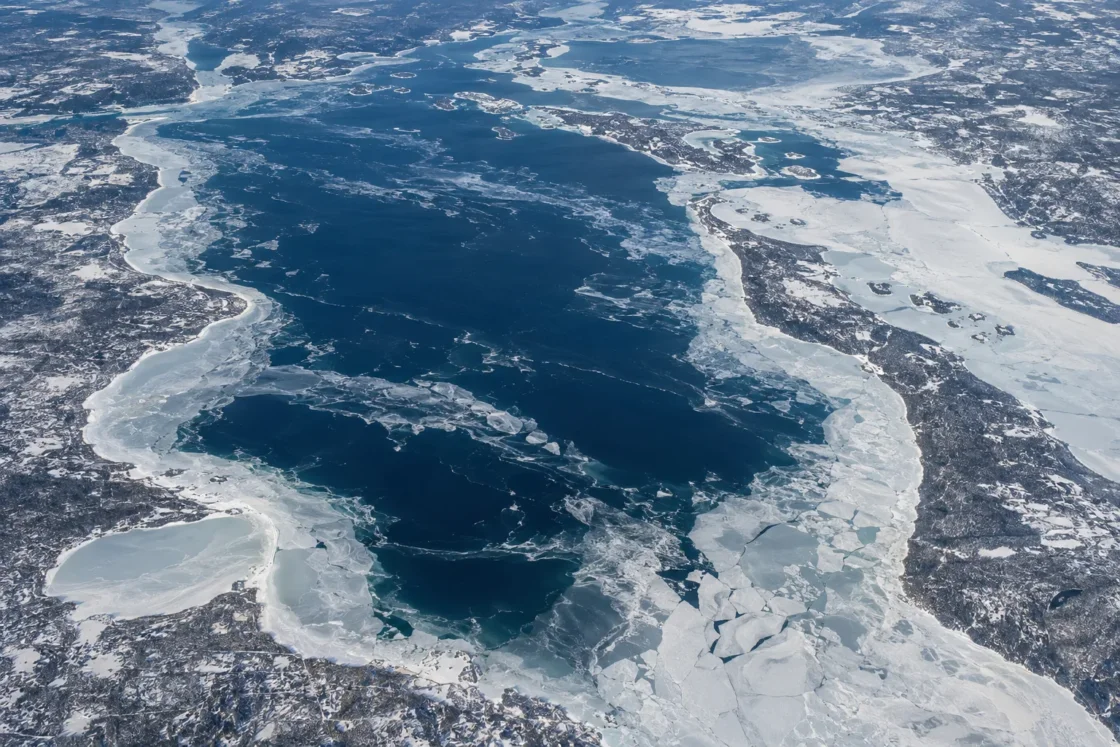
Widespread seasonal ice with large open-water areas in many winters
Official Monitoring and Peer ReviewedCanadian Ice Service — Great Lakes Ice Climate Normals 1991–2020Canadian Coast Guard — Ice Climatology for Lake Huron and Georgian BayNOAA GLERL — Historical Great Lakes Ice CoverWang et al. — Temporal and Spatial Variability of Great Lakes Ice Cover, 1973–2010Evidence: HighIce develops first in sheltered and nearshore water, while the deep open lake retains heat and is repeatedly mixed by wind, delaying continuous lake-wide cover.
Where Is Lake Huron?
Ontario / Michigan · Canada / United States
Lake Huron on the Globe
Rotate the world or focus directly on the lake.
Measured Ice and Freeze Data
Freeze and Ice Cover Through the Year
Month-level states are shown only when supported. Unclassified months remain explicitly marked.
Evidence Behind the Freeze Profile
The 1991–2020 Canadian Ice Service normal places Lake Huron's maximum near mid-February at about 43%, while Georgian Bay reaches about 85% later in February.
Official MonitoringCanadian Ice Service — Great Lakes Ice Climate Normals 1991–2020Evidence: HighCanadian Coast Guard climatology describes ice spreading outward from coastal sectors while deep central and northern Lake Huron usually retain open water.
Government Lake DataCanadian Coast Guard — Ice Climatology for Lake Huron and Georgian BayEvidence: HighNOAA GLERL's historical record lists a Lake Huron annual maximum of 98.2% in 1994 and a low of 22.8% in 2012, showing large year-to-year spread.
Official MonitoringNOAA GLERL — Historical Great Lakes Ice CoverEvidence: HighThe peer-reviewed analysis estimated a -1.64% per year trend in annual Lake Huron ice coverage for that 38-year study period and cautioned against extrapolating the fitted trend beyond the period analyzed.
Peer ReviewedWang et al. — Temporal and Spatial Variability of Great Lakes Ice Cover, 1973–2010Evidence: HighNASA reported, using NOAA GLERL data, that Lake Huron reached 77% ice cover on February 9, 2026.
Official Seasonal AnalysisNASA MODIS — Lake Huron, March 2, 2026Evidence: ModerateSources
- Canadian Ice Service — Great Lakes Ice Climate Normals 1991–2020
- Canadian Coast Guard — Ice Climatology for Lake Huron and Georgian Bay
- NOAA GLERL — Historical Great Lakes Ice Cover
- Canadian Geographical Names Database — Lake Huron
- Wang et al. — Temporal and Spatial Variability of Great Lakes Ice Cover, 1973–2010
- NASA MODIS — Lake Huron, March 2, 2026
- Canada Water Agency — Lake Huron Drainage Basin Map
Lake Huron develops widespread winter ice, but a complete lake-wide freeze is not its normal state. Ice usually advances first through sheltered northern channels, bays, and nearshore water, while the deep central and northern open lake can remain exposed even when winter coverage is extensive.
Ice builds from sheltered water toward the open lake
Lake Huron does not freeze as a single surface at one moment. The first seasonal ice tends to appear around the North Channel and other protected coastal sectors, then spreads outward as cold weather persists. The Canadian Ice Service places the median ice season from early December to late April, while the longer Great Lakes record also shows that first ice can begin near the end of November in some years.
The open lake behaves differently from a shallow bay. Large volumes of water store heat into winter, and wind repeatedly mixes the surface layer before stable ice can form. That combination delays continuous cover over the deeper basin. It also helps explain why shoreline ice can be extensive while broad offshore areas remain open.
Georgian Bay and the North Channel freeze more readily
The contrast inside the Lake Huron system is large enough that basin-wide percentages can hide what is happening locally. In the 1991–2020 Canadian Ice Service normals, Lake Huron reaches its normal maximum around mid-February at about 43% ice cover, whereas Georgian Bay reaches about 85% later in February.
The North Channel also develops persistent seasonal ice, with land-fast ice occurring in parts of the channel during winter. These protected waters cool and stabilize earlier than the exposed central lake. A winter scene from a bay, harbour, or channel therefore should not be treated as evidence that the whole of Lake Huron has frozen over.
Near-total ice years are exceptional, not the baseline
Lake Huron has a wide historical range. NOAA GLERL records an annual maximum of 98.2% in 1994, while the 2012 annual maximum was only 22.8%. Those values describe the fraction of the lake surface covered by ice at the seasonal maximum, not a permanent or uniformly thick sheet.
The 2026 winter provides a recent example of extensive but incomplete cover. NOAA GLERL data reported by NASA placed Lake Huron at 77% ice cover on February 9, 2026. That level still did not represent complete surface closure.
This year-to-year spread is part of Lake Huron’s winter behavior. Cold-air outbreaks, wind patterns, the timing of early-winter cooling, and large-scale atmospheric circulation can shift both the amount and distribution of ice. A single winter is therefore a poor substitute for the multi-decade record.
The long record shows declining annual ice coverage
A peer-reviewed analysis of Great Lakes ice from 1973 through 2010 found a downward trend in annual Lake Huron ice coverage. For that study period, the fitted rate for Lake Huron was -1.64% per year. The authors also emphasized strong interannual and multi-year variability, so the fitted line is a description of that historical interval rather than a fixed rate that should be projected indefinitely.
The same record links much of the year-to-year variability across the Great Lakes to changes in large-scale atmospheric circulation. Those patterns alter the frequency and strength of cold-air outbreaks over the lakes, which in turn affects heat loss, ice growth, and the timing of breakup.
Ice-cover percentage is an area measurement, not a uniform ice sheet
Operational ice charts combine mapped ice concentration across the lake into a lake-wide percentage. A value such as 43%, 77%, or 98% describes horizontal surface coverage. It does not mean every covered area has the same ice thickness, age, mobility, or continuity.
This distinction matters on Lake Huron because wind can move pack ice, open leads, compress floes, and create ridging while other sectors remain comparatively stable. Coastal ice can also persist after offshore ice has retreated. The most accurate description of Lake Huron in winter is therefore spatial: protected waters commonly freeze first and most extensively, while the deep open lake remains the hardest part of the system to cover.
Similar Lakes by Freeze Pattern
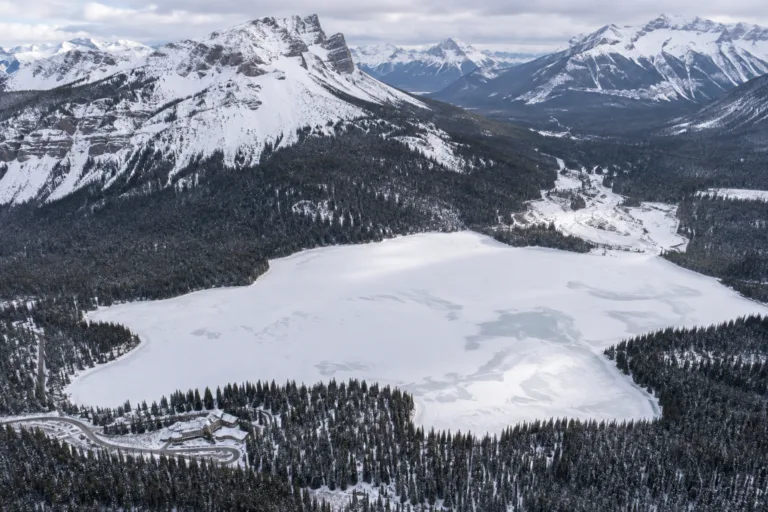
Emerald Lake Freeze
Usually Fully Freezes
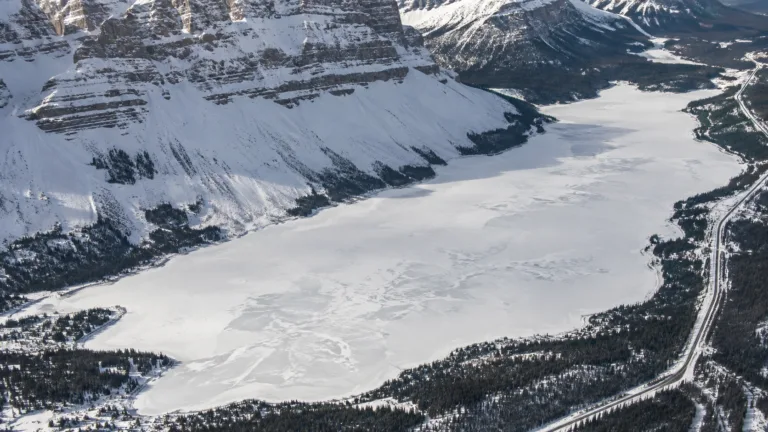
Bow Lake Freeze
Usually Fully Freezes
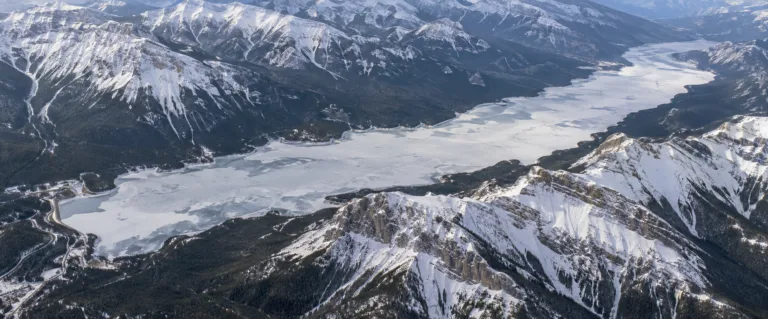
Lake Minnewanka Freeze
Usually Fully Freezes
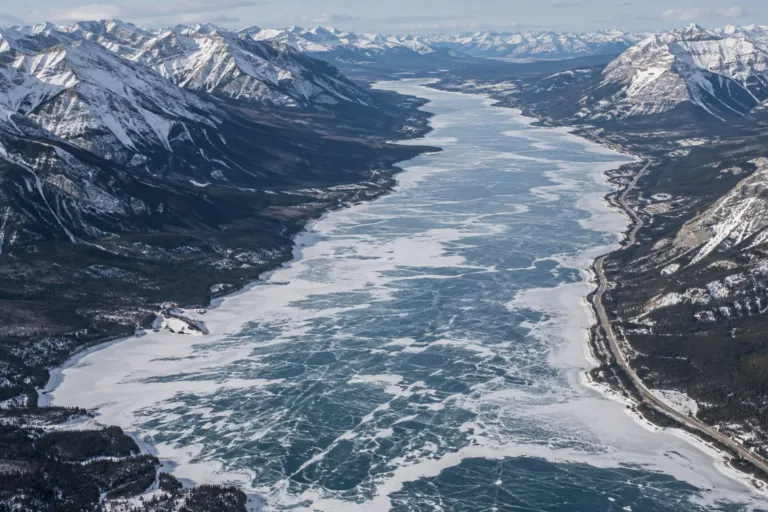
Abraham Lake Freeze
Usually Fully Freezes
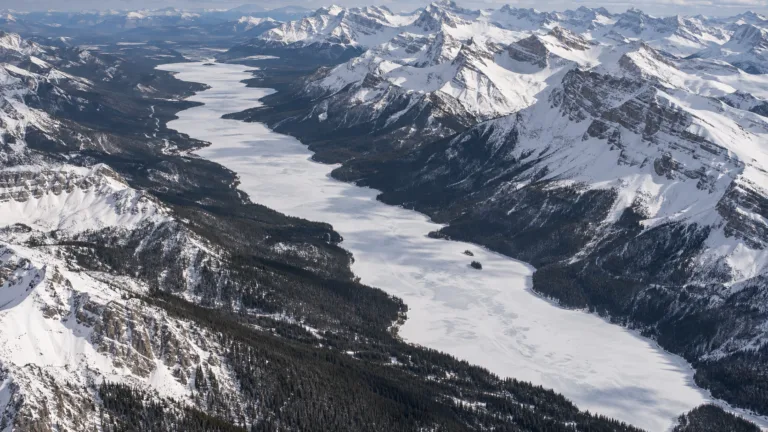
Maligne Lake Freeze
Usually Fully Freezes
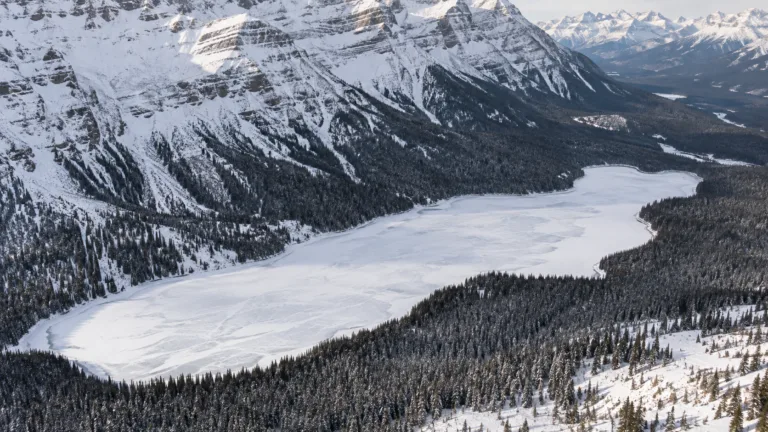
Peyto Lake Freeze
Usually Fully Freezes