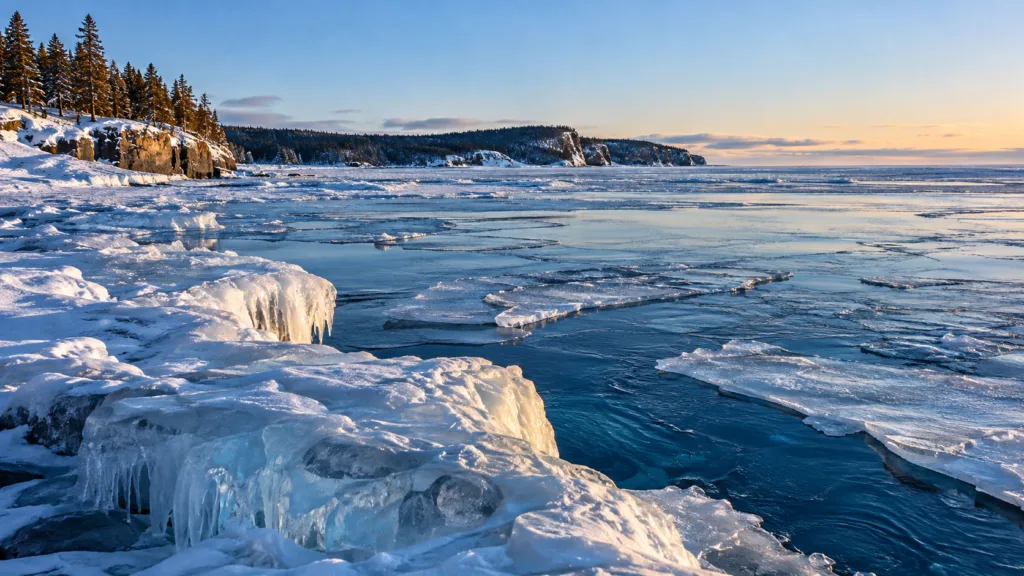
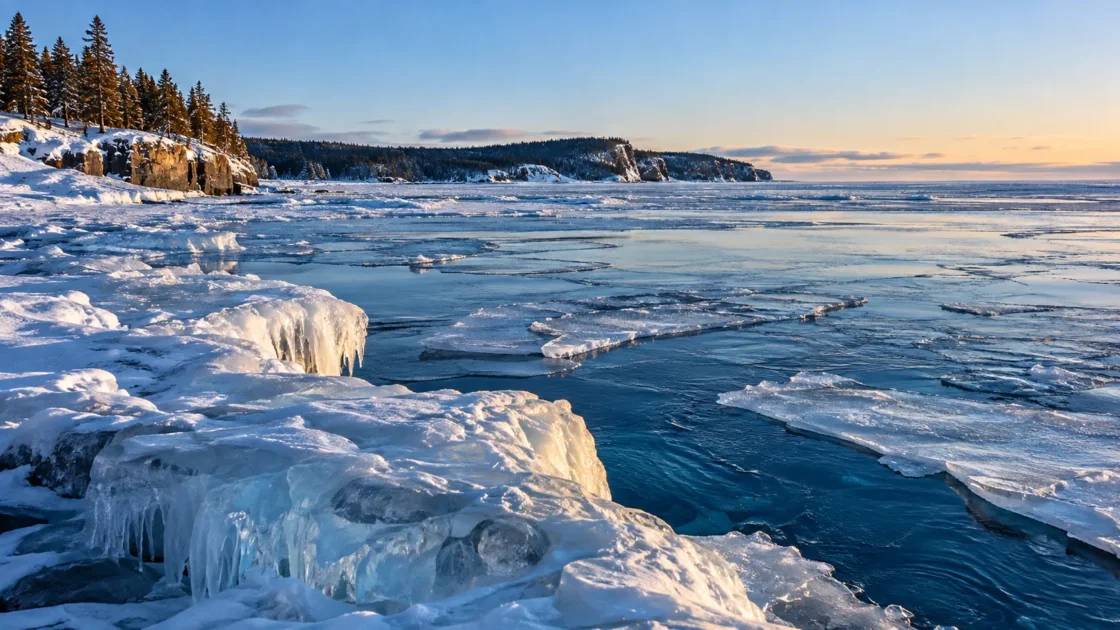
Extensive seasonal ice is common, but complete lake-wide freeze-over is rare.
Official Monitoring and NOAA ClimatologyNOAA Great Lakes Environmental Research Laboratory — Historical Ice CoverNOAA GLERL Technical Memorandum 170 — Great Lakes Ice Climatology Update, 1973–2017U.S. Environmental Protection Agency — Lake SuperiorGeophysical Research Letters — Estimating Ice Cover on the Great Lakes Using Seismic Ambient NoiseEvidence: HighVery cold regional winters favor ice growth, while Lake Superior's great depth and heat storage delay freezing in the deep interior; shallow coastal areas and embayments freeze first.
Where Is Lake Superior?
Canada / United States
Lake Superior on the Globe
Rotate the world or focus directly on the lake.
Measured Ice and Freeze Data
Freeze and Ice Cover Through the Year
Month-level states are shown only when supported. Unclassified months remain explicitly marked.
Evidence Behind the Freeze Profile
NOAA records a 100% annual maximum in 1996, while the 1973–2017 mean annual maximum was 63%, placing complete coverage at the severe end of a highly variable record.
Official Monitoring and NOAA ClimatologyNOAA Great Lakes Environmental Research Laboratory — Historical Ice CoverNOAA GLERL Technical Memorandum 170 — Great Lakes Ice Climatology Update, 1973–2017Evidence: HighThe 1973–2017 NOAA climatology places Superior's typical maximum around early March and shows ice decay continuing through spring.
NOAA ClimatologyNOAA GLERL Technical Memorandum 170 — Great Lakes Ice Climatology Update, 1973–2017Evidence: HighIn 2024, Lake Superior's seasonal average fell to a record-low 2.6%, while a short cold snap still produced a substantially higher one-day maximum.
Official Seasonal AnalysisNOAA GLERL — A Final Look at Record-Low Great Lakes Ice in 2024Evidence: HighNOAA found a negative 1973–2017 trend in annual mean ice cover and explicitly cautioned that trends calculated for a fixed study period should not be extrapolated beyond that period.
NOAA Trend AnalysisNOAA GLERL Technical Memorandum 170 — Great Lakes Ice Climatology Update, 1973–2017Evidence: HighSources
- NOAA Great Lakes Environmental Research Laboratory — Historical Ice Cover
- NOAA GLERL Technical Memorandum 170 — Great Lakes Ice Climatology Update, 1973–2017
- NOAA GLERL — A Final Look at Record-Low Great Lakes Ice in 2024
- U.S. Environmental Protection Agency — Lake Superior
- Natural Resources Canada — Canadian Geographical Names Database: Lake Superior
- Geophysical Research Letters — Estimating Ice Cover on the Great Lakes Using Seismic Ambient Noise
Lake Superior develops substantial seasonal ice, but complete surface coverage is not its normal winter state. The most important distinction is spatial: protected and shallow parts of the lake can freeze while large areas of the deep offshore basin remain open, so reports of local frozen conditions should not be read as evidence that the entire lake has frozen over.
Why Lake Superior Can Have Heavy Ice Without Freezing Completely
Lake Superior combines two characteristics that pull its winter ice regime in opposite directions. It sits in a cold continental climate where prolonged below-freezing air temperatures can support major ice growth, yet it is also exceptionally deep. The U.S. Environmental Protection Agency lists an average depth of about 147 meters and a maximum depth of about 406 meters. That large water mass stores heat and takes time to cool before widespread surface freezing can develop.
This helps explain why ice coverage cannot be inferred from air temperature alone. A severe cold spell can rapidly expand ice across the surface, but the open-lake basin begins winter with far more stored heat than shallow bays and coastal shelves. Winter severity, autumn cooling and the amount of heat retained in the water all influence how far the ice eventually spreads.
Ice Builds From the Shore Toward the Deep Interior
Lake Superior does not freeze as a single uniform sheet. NOAA climatology shows ice beginning around shallow coasts and embayments before progressing into more exposed water. Recent peer-reviewed work using the modern lake-wide ice dataset describes the same broad spatial pattern: ice tends to develop around the lake margins and advance inward toward the deepest parts of the basin.
That difference matters when interpreting winter observations. A bay, harbor or nearshore sector may have substantial ice while offshore water remains open. Conversely, a severe winter can eventually connect large areas of coastal and offshore ice. The percentage of the whole lake covered by ice is therefore a much more useful lake-wide measure than the appearance of any single shoreline location.
Why the Annual Maximum Can Be Misleading
The highest ice percentage reached during a winter is an important statistic, but it can exaggerate how icy the season was as a whole. A short cold outbreak can create a sharp temporary increase, after which wind, warmer weather and spring heating reduce the coverage again.
The 2024 season is a clear example. NOAA reported a record-low Lake Superior seasonal average of 2.6%, yet the lake briefly reached 12% coverage after a cold snap. The peak was real, but it did not describe the conditions that dominated most of the season. For that reason, annual maximum ice cover and seasonal average ice cover answer different questions and should not be treated as interchangeable statistics.
A Complete Freeze Is Possible, but It Is an Extreme
Lake Superior has reached complete measured coverage. NOAA’s historical record lists 1996 at a 100% annual maximum. That event demonstrates that the lake is physically capable of freezing over under sufficiently severe conditions, but it should not be turned into a description of an ordinary winter.
The wider climatology makes the distinction clear. Across 1973–2017, NOAA calculated a mean annual maximum of 63%, with large variability from winter to winter. Some seasons produce very extensive ice, while mild winters leave most of the surface open. The useful description of Lake Superior is therefore neither “it never freezes over” nor “it freezes over every winter.” Its defining feature is a highly variable seasonal ice cover in which complete coverage lies near the extreme end of the range.
The Long-Term Record Shows Less Ice, but Not a Smooth Decline
NOAA’s 1973–2017 analysis found a significant downward trend in Lake Superior’s annual mean ice cover. The fitted decline for that specific period was 0.62 percentage points per year, the largest negative annual-mean trend among the individual Great Lakes in that analysis.
The same NOAA report also warns against treating a fitted trend as a prediction. Lake ice has strong interannual and decadal variability, so high-ice winters can still occur within a longer period of declining average coverage. The reported rate describes the 1973–2017 record; it should not simply be projected forward as though each future winter will lose the same amount of ice.
What Lake-Wide Ice Percentages Actually Measure
The modern Great Lakes record is built from operational ice charts and remote-sensing observations produced through U.S. and Canadian ice-monitoring programs. NOAA processes those observations into gridded data that can be summarized as the percentage of Lake Superior’s surface covered by ice on a given date.
That number describes horizontal surface coverage. It is not an ice-thickness measurement, and it does not reveal whether every covered part of the lake has the same ice type or physical condition. The monitoring record is most useful for comparing seasonal extent, timing, spatial patterns and changes between winters while keeping those different ice properties separate.
Similar Lakes by Freeze Pattern
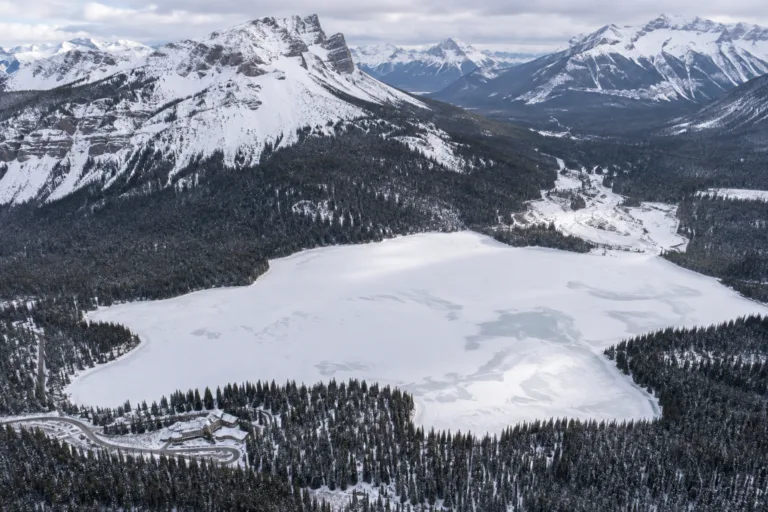
Emerald Lake Freeze
Usually Fully Freezes
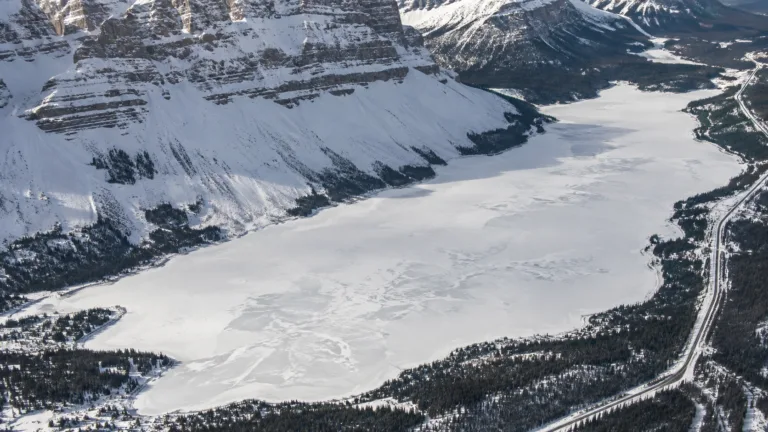
Bow Lake Freeze
Usually Fully Freezes
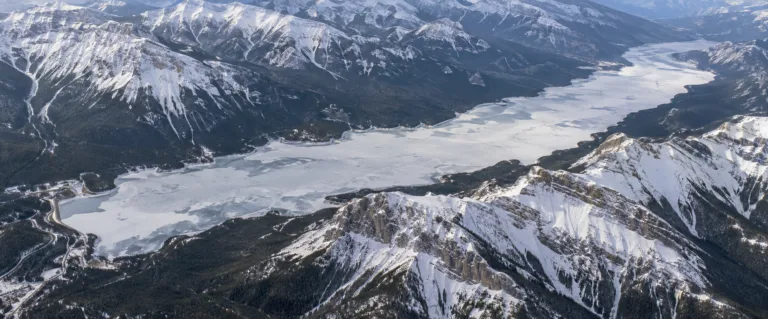
Lake Minnewanka Freeze
Usually Fully Freezes
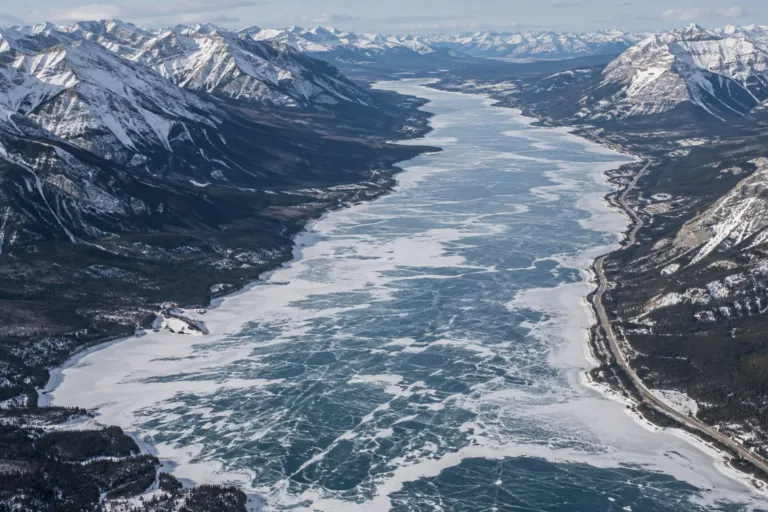
Abraham Lake Freeze
Usually Fully Freezes
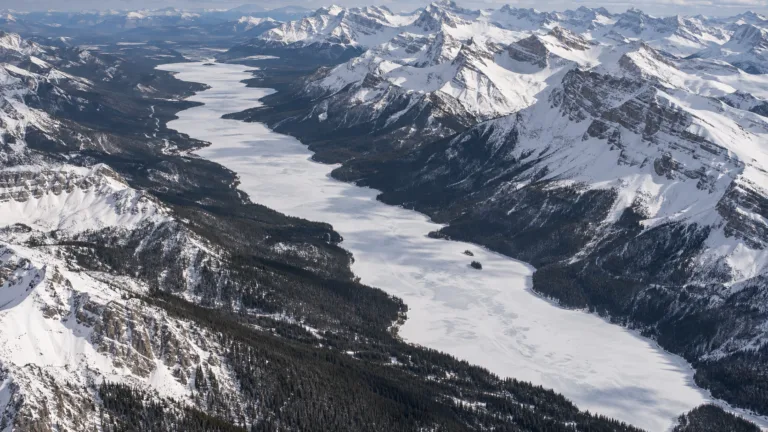
Maligne Lake Freeze
Usually Fully Freezes
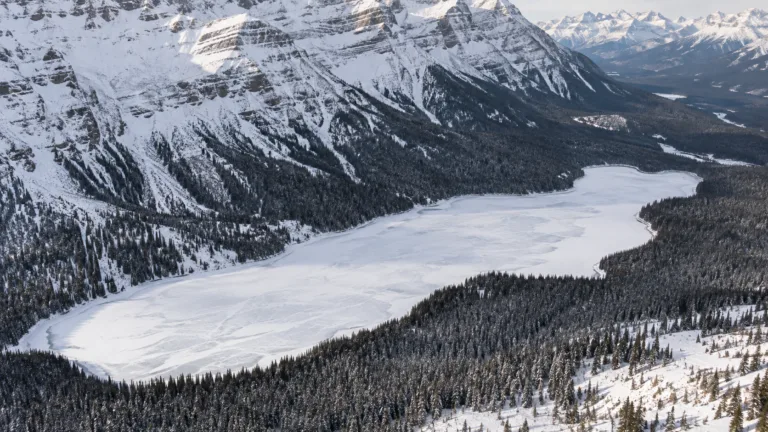
Peyto Lake Freeze
Usually Fully Freezes