
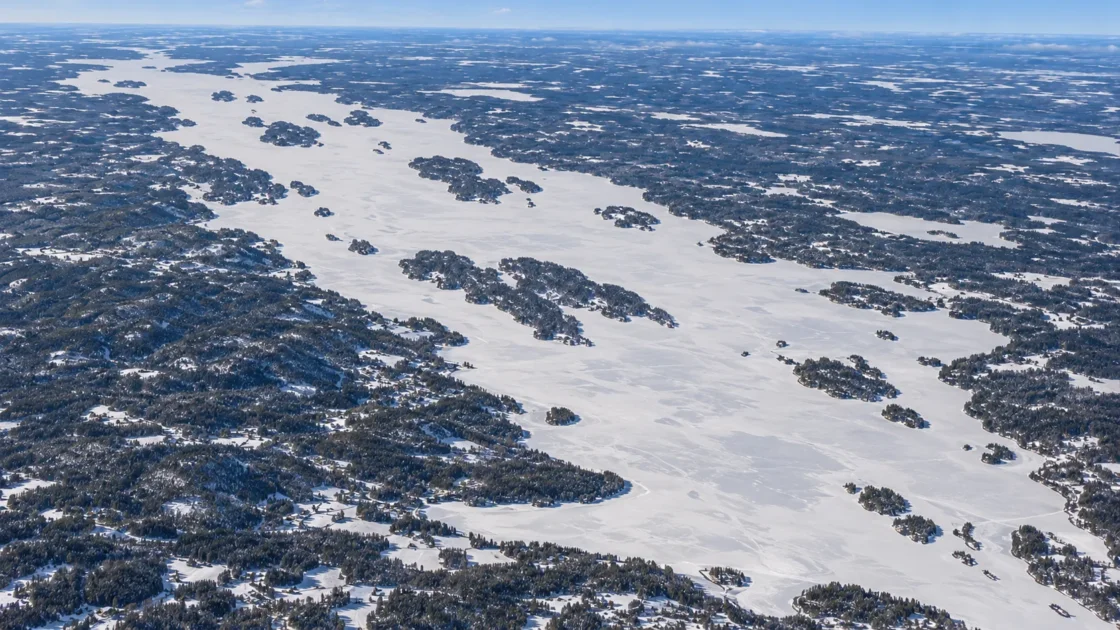
Persistent seasonal ice with late-autumn to early-winter ice-on and breakup in May
Historical Monitoring RecordSharma et al. — Long-term ice phenology records spanning up to 578 years for 78 lakesFilazzola et al. — Long-term ice phenology records for 78 lakes, datasetChoulga et al. — Upgraded global mapping information for earth system modellingWorld Lake Database — Lake PielinenKorhonen — Long-term changes in lake ice cover in FinlandEvidence: ModerateCold winters support persistent ice, while the lake's large area and 61 m maximum depth make shoreline observations an imperfect proxy for the entire basin.
Where Is Lake Pielinen?
Finland
Lake Pielinen on the Globe
Rotate the world or focus directly on the lake.
Measured Ice and Freeze Data
Freeze and Ice Cover Through the Year
Month-level states are shown only when supported. Unclassified months remain explicitly marked.
Evidence Behind the Freeze Profile
Pielinen has published ice-on and ice-off observations extending from the 1880s through the 2020–2021 ice season. Finnish ice-on in this series means final freeze-up within sight of the observation site.
Scientific DatasetSharma et al. — Long-term ice phenology records spanning up to 578 years for 78 lakesFilazzola et al. — Long-term ice phenology records for 78 lakes, datasetEvidence: HighFinnish monitoring separates shoreline, bay, within-sight and whole-lake freezing. Pielinen's long ice-on series therefore should not be treated as an exact timestamp for simultaneous closure of every part of the lake.
Peer ReviewedSharma et al. — Long-term ice phenology records spanning up to 578 years for 78 lakesChoulga et al. — Upgraded global mapping information for earth system modellingEvidence: HighA 2006 analysis reported earlier Pielinen breakup over 1885–2002 and a shorter ice-cover duration over 1886–2002, while flagging record-quality and gap-filling limitations for this lake.
Peer ReviewedKorhonen — Long-term changes in lake ice cover in FinlandEvidence: ModerateThe 58 cm late-March reference is a Pielinen–Nurmes point measurement for 1991–2020, not a lake-wide ice-thickness value and not an ice-cover percentage.
Official MonitoringFinnish Environment Institute — Hydrological monthly statistics: ice thicknessEvidence: HighSources
- Sharma et al. — Long-term ice phenology records spanning up to 578 years for 78 lakes
- Filazzola et al. — Long-term ice phenology records for 78 lakes, dataset
- Choulga et al. — Upgraded global mapping information for earth system modelling
- World Lake Database — Lake Pielinen
- Finnish Environment Institute — Hydrological monthly statistics: ice thickness
- Korhonen — Long-term changes in lake ice cover in Finland
Lake Pielinen regularly develops persistent seasonal ice, but its long phenology record needs a precise reading. The Finnish “ice-on” series records final freeze-up within the observer’s visible sector; on a lake of roughly 894 km², that is not the same as proving that every bay and open-water reach froze on one date.
What Pielinen’s ice-on date actually measures
Finland’s monitoring convention distinguishes several stages of freezing: ice along the shores, ice in bays, freeze-up within sight of the observation point, and freeze-up of the whole lake. The long Pielinen series uses the within-sight definition for ice-on. Whole-lake views were not required throughout the record, so the date is best read as a consistent phenological marker rather than a basin-wide switch from open water to complete ice.
The spatial scale is especially relevant here. A peer-reviewed lake-model verification study placed Pielinen’s ice observation point at 63.5418° N, 29.1314° E on or close to the shore, while a separate water-temperature point used for the same lake was at 63.2705° N, 29.6067° E in the middle of the lake. The two sites were about 38.45 km apart. That distance illustrates why a shoreline observation can describe seasonal timing well without resolving the exact state of the entire surface.
A shorter observed ice season appears across the long record
Johanna Korhonen’s 2006 analysis reported that Pielinen’s breakup moved earlier by about 0.76–0.79 days per decade over 1885–2002. The same study reported a shortening of ice-cover duration of about 1.51 days per decade over 1886–2002, but that duration result depended on filling gaps with neighboring-station records. Pielinen was also flagged as a series containing some observations considered unreliable, so the trend is useful evidence of direction and scale rather than a perfectly uniform century-long measurement.
The published phenology dates also allow a simpler comparison between two multi-year windows. For 1960–1980, the median observed ice-on-to-ice-off interval is 177 days. For 2001–2020, it is 152 days, while median observed ice-on shifts from 23 November to 10 December. This 25-day difference between the two windows is descriptive, not a fitted trend estimate, but it is consistent with a later start and shorter observed ice season in the more recent period.
Why the main basin can lag sheltered water
Pielinen is a large freshwater lake with an in-situ mean depth of about 10.1 m and a maximum depth of 61 m. The World Lake Database classifies it as dimictic: the water column turns over in spring and autumn and becomes stratified in both summer and winter. Before persistent ice can establish, autumn cooling and mixing must remove stored heat from the water column.
Large open reaches are also exposed to more wind and wave action than protected margins. Those physical differences can keep parts of the lake mixed while quieter areas cool more quickly. This does not mean the long ice-on series is inaccurate; it explains why a single observation sector and a whole-lake freeze event are different measurements.
Nurmes thickness data describe one monitored point
Finnish Environment Institute statistics give a 1991–2020 late-March ice thickness of 58 cm at the Pielinen–Nurmes station. The same value was measured there on 30 March 2025, while the 2024–2025 station maximum was 62 cm. These figures describe vertical ice thickness at a monitored location. They do not state how much of Lake Pielinen was ice covered, and they should not be generalized into a uniform thickness for the lake’s open reaches, bays, or shoreline zones.
Similar Lakes by Freeze Pattern
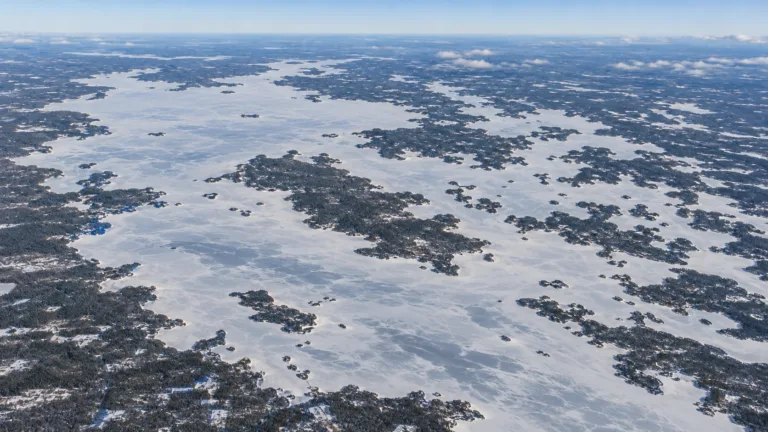
Lake Oulujärvi Freeze
Usually Fully Freezes
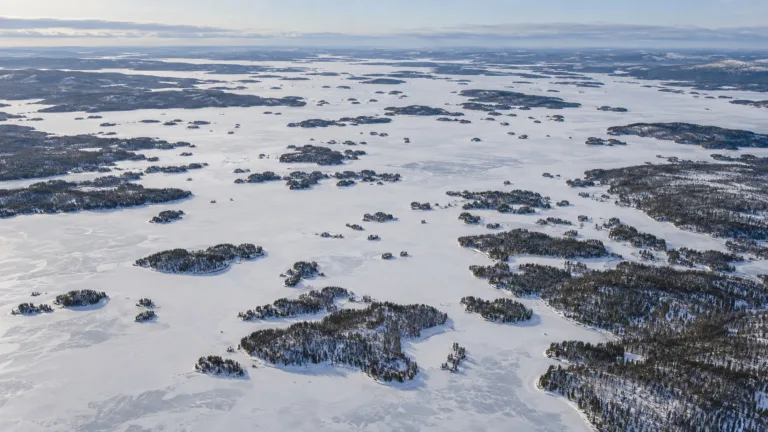
Lake Inari Freeze
Usually Fully Freezes
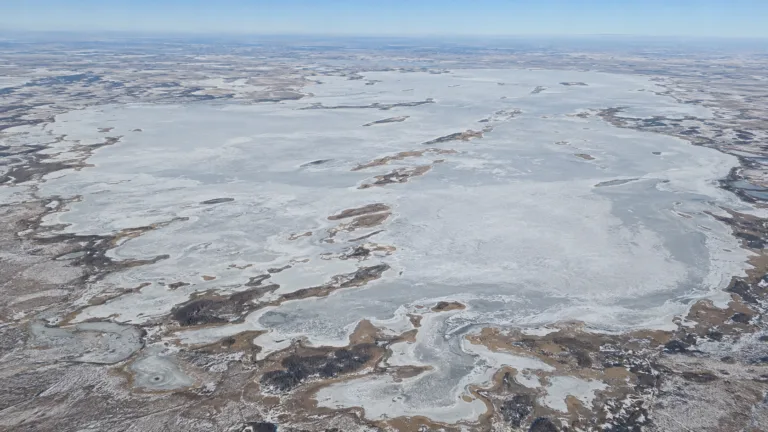
Lake Chany Freeze
Usually Fully Freezes

Lake Onega Freeze
Usually Fully Freezes

Lake Ladoga Freeze
Usually Fully Freezes
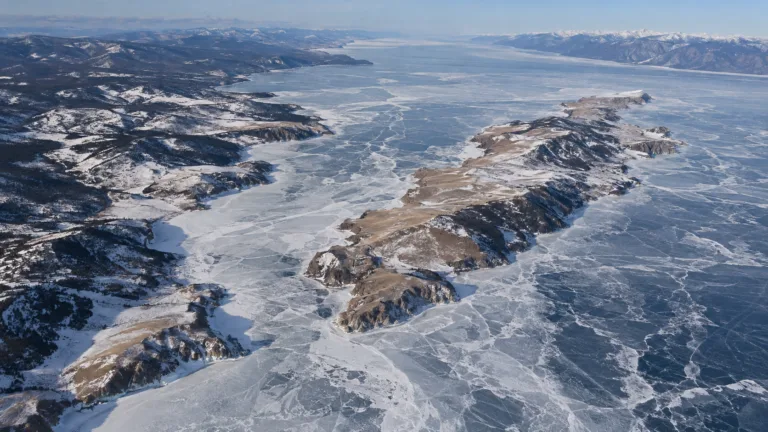
Lake Baikal Freeze
Usually Fully Freezes