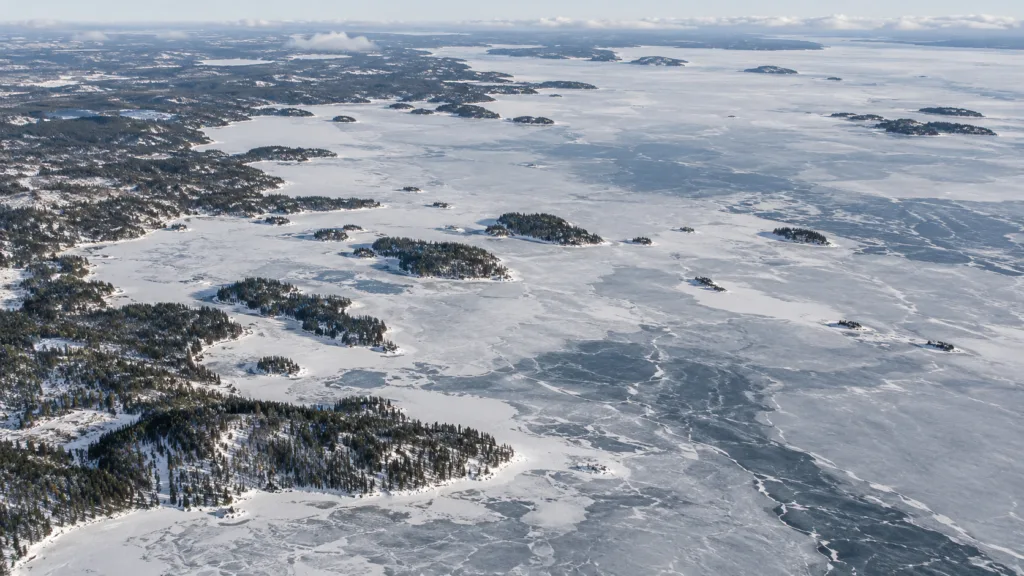
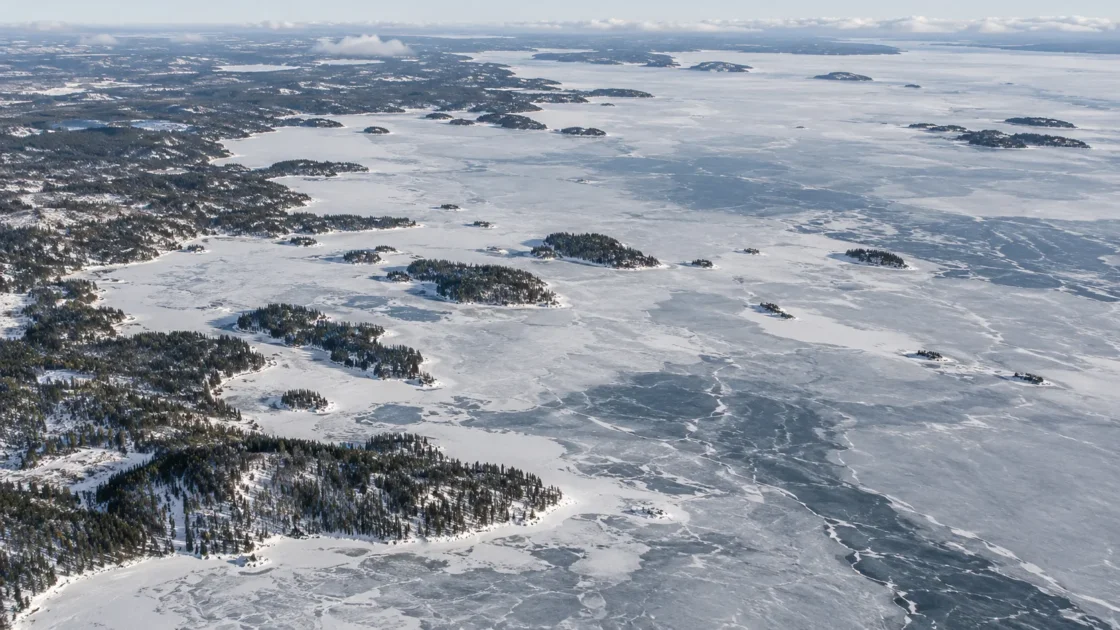
Seasonal whole-lake ice cover with a long but highly variable complete-freeze phase
Peer Reviewed Satellite and Long-Term MonitoringVariability of the Lake Onega Ice Coverage in the Period 2000–2018 According to Satellite DataVariations of Indicative Dates of Ice Regime on Lake Onego Based on Ground Air TemperatureIce Phenology of Different Types of Lakes in Karelia According to Long-Term Observations (1950–2021)Evidence: HighLake Onega retains substantial heat into autumn, delaying whole-lake freeze after bays and nearshore water begin icing. Sustained cold is needed to remove this stored heat, while spring ice loss proceeds more rapidly once warming and breakup begin.
Where Is Lake Onega?
Republic of Karelia / Leningrad Oblast / Vologda Oblast · Russia
Lake Onega on the Globe
Rotate the world or focus directly on the lake.
Measured Ice and Freeze Data
Freeze and Ice Cover Through the Year
Month-level states are shown only when supported. Unclassified months remain explicitly marked.
Evidence Behind the Freeze Profile
A daily 2000–2018 satellite series combining NSIDC and NOAA NESDIS products with MODIS information placed average ice formation from November 25 to January 19, complete freeze-up from January 20 to April 12, and ice destruction from April 13 to May 17.
Peer Reviewed Satellite AnalysisVariability of the Lake Onega Ice Coverage in the Period 2000–2018 According to Satellite DataEvidence: HighA 1950–2021 analysis of Karelian lake records found later ice-on and earlier ice-off across the study lakes, with Lake Onega and Segozero showing about 35–40 days of reduction in ice-cover duration.
Long-Term Scientific RecordIce Phenology of Different Types of Lakes in Karelia According to Long-Term Observations (1950–2021)Evidence: HighThe bay is a small, morphologically distinct part of Lake Onega. During the exceptionally warm 2019–2020 winter it did not become completely ice-covered, and intermittent ice fields near the monitoring station were observed only from late January to mid-March.
Peer Reviewed Local MonitoringVariations of Indicative Dates of Ice Regime on Lake Onego Based on Ground Air TemperatureSeasonal and Inter-Annual Variability of Water Temperature in Petrozavodsk Bay of Lake OnegaEvidence: HighSources
- Variability of the Lake Onega Ice Coverage in the Period 2000–2018 According to Satellite Data
- Variations of Indicative Dates of Ice Regime on Lake Onego Based on Ground Air Temperature
- Ice Phenology of Different Types of Lakes in Karelia According to Long-Term Observations (1950–2021)
- Seasonal and Inter-Annual Variability of Water Temperature in Petrozavodsk Bay of Lake Onega
- World Lake Database — Lake Onega
- NGA GEOnet Names Server — Lake Onega
Lake Onega normally develops a complete seasonal ice cover, but the important distinction is between the first ice in sheltered water and freeze-over of the lake as a whole. Its large volume carries autumn heat well into the cold season, so freeze-up is prolonged; once spring breakup starts, the loss of ice is comparatively faster.
Whole-lake freeze comes well after the first bay ice
Lake Onega covers close to 9,900 km² and reaches about 120 m at its deepest point. That scale matters in winter. Shallow and sheltered sectors can cool to the freezing point while the open lake is still releasing heat stored during the warm season. The resulting ice edge can therefore move across the lake for weeks before continuous cover is established.
This is also why a shoreline observation is not interchangeable with a whole-lake freeze date. Earlier phenological records around Petrozavodsk were useful for documenting local conditions, but Petrozavodsk Bay occupies less than two percent of the lake surface and freezes earlier than much of the open water. Satellite monitoring provides a better basis for describing the timing of complete freeze-over across Lake Onega itself.
Autumn temperature strongly shifts the date of complete freeze-up
The 2000–2018 record shows that Lake Onega’s freeze calendar is sensitive to the amount of heat remaining in the water as winter develops. Warmer September and October conditions slow the loss of stored summer heat, so a larger accumulation of below-freezing air temperatures is needed before the surface can reach the complete-freeze stage.
For the same period, changes in November–December and December–January air temperature were closely related to the timing of complete freeze-up. A 1°C difference in the relevant mean air temperature corresponded to roughly a five-day shift in the complete-freeze date. The relationship is not a fixed forecasting rule, but it explains why a single calendar date cannot describe every Onega winter.
The lake can change from open water to broad ice cover very quickly
A slow seasonal buildup does not mean the daily change is always gradual. Satellite analysis recorded the largest 24-hour change in ice coverage during the 2000–2018 study period between January 8 and 9, 2016, when the ice-covered share of the lake changed by 62.5 percentage points. Large day-to-day changes of this kind are one reason daily satellite observations are more informative than occasional aerial or shoreline checks for a lake of Onega’s size.
Wind, stored heat and short episodes of intense cold can leave a patchwork of open water and ice during the formation stage. Once enough of the lake has cooled to the freezing point, the remaining open areas may close rapidly.
Spring ice disappears faster than it forms
The satellite-derived seasonal curve for 2000–2018 estimated an average ice-cover formation rate of about 1.76% of lake area per day. During spring destruction, the corresponding rate was about 2.90% per day, roughly 1.65 times faster.
This asymmetry gives Lake Onega a long autumn-to-midwinter transition but a more compressed breakup period. Rising solar input, warmer air and open-water areas that absorb additional heat all work in the same direction once the winter cover begins to deteriorate. Breakup still varies strongly from year to year, so April and May are better treated as a transition window than as a fixed ice-off date.
Petrozavodsk Bay shows how unusual warm winters can alter local ice
The winter of 2019–2020 produced an unusual result in Petrozavodsk Bay. The bay did not become completely ice-covered, and near the monitoring station ice fields appeared intermittently from late January to mid-March. The following two winters had ice-covered periods of about 3.5 and 5 months, illustrating how sharply local conditions can change between seasons.
That episode should not be converted into a lake-wide rule. The bay has its own depth, shoreline geometry and river influence, and its monitoring record describes a specific portion of Lake Onega. It is most useful as evidence of how sensitive sheltered sectors can be to an exceptionally mild winter.
The long-term record points to a shorter ice season
A 2026 analysis of lake-ice phenology across Karelia examined observations from 1950 through 2021. Across the nine studied lakes, ice-on shifted later and ice-off shifted earlier. Lake Onega and Segozero, the large lakes in the group, showed reductions of roughly 35–40 days in ice-cover duration over the study period.
For Onega, the change is especially relevant because delayed freeze-up removes days from the season before stable whole-lake cover is established. Earlier studies using shorter periods also found later freeze development and declining ice duration, so the direction of change is consistent across several observational approaches even when their exact duration estimates differ.
Why published ice-duration averages differ slightly
Two studies using the 2000–2018 satellite-era record give slightly different summary durations because they calculate the seasonal statistics differently. The analysis of the pooled chronological ice-cover curve produced about 175 days of ice phenomena and 84 days of complete freeze-up. A later analysis based on annual phase durations reported averages of 171 and 90 days respectively.
These values do not describe opposing freeze regimes. They reflect different ways of summarizing a season whose start, complete-cover interval and breakup dates vary widely from winter to winter. For Lake Onega, date ranges and clearly defined ice phases are therefore more informative than treating one duration value as an exact annual norm.
Similar Lakes by Freeze Pattern
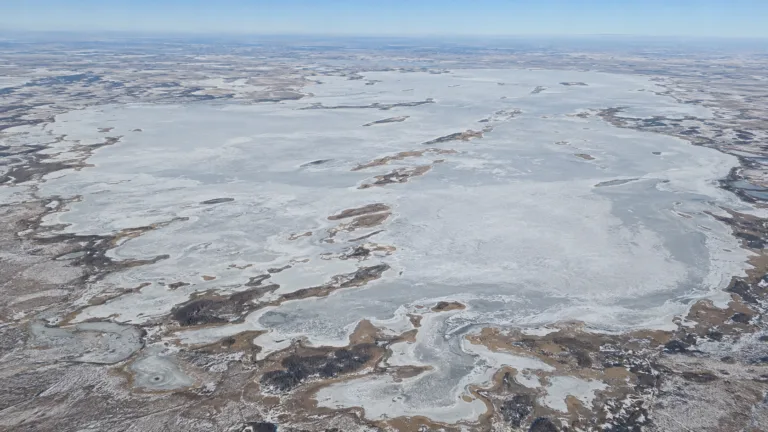
Lake Chany Freeze
Usually Fully Freezes

Lake Ladoga Freeze
Usually Fully Freezes
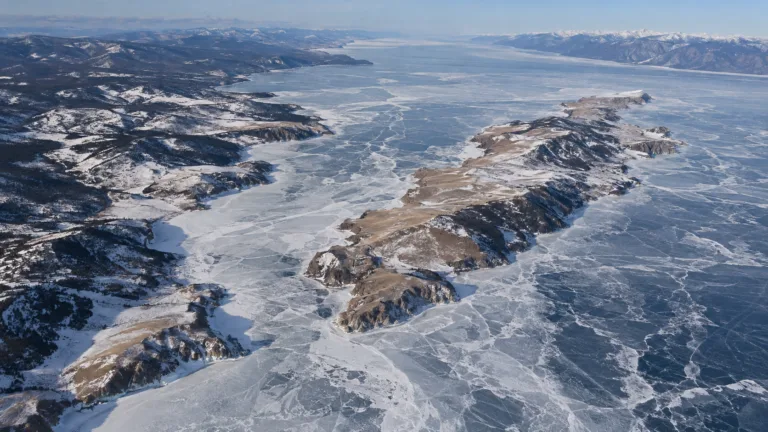
Lake Baikal Freeze
Usually Fully Freezes
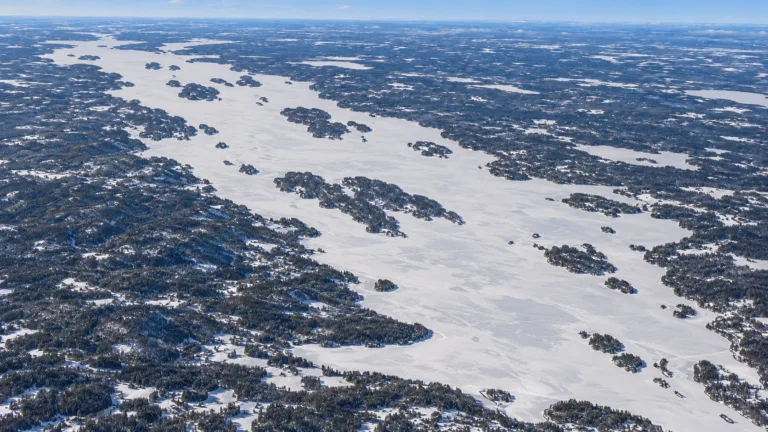
Lake Pielinen Freeze
Usually Fully Freezes
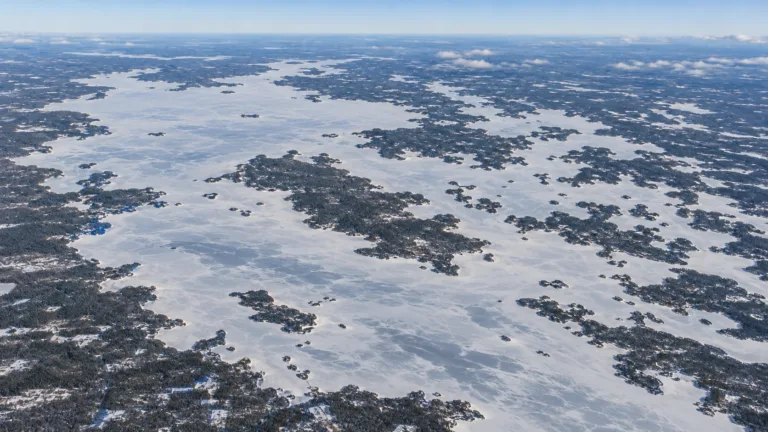
Lake Oulujärvi Freeze
Usually Fully Freezes
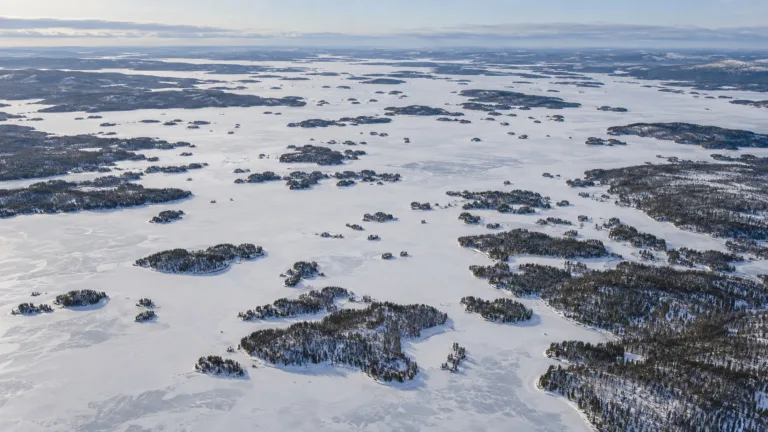
Lake Inari Freeze
Usually Fully Freezes