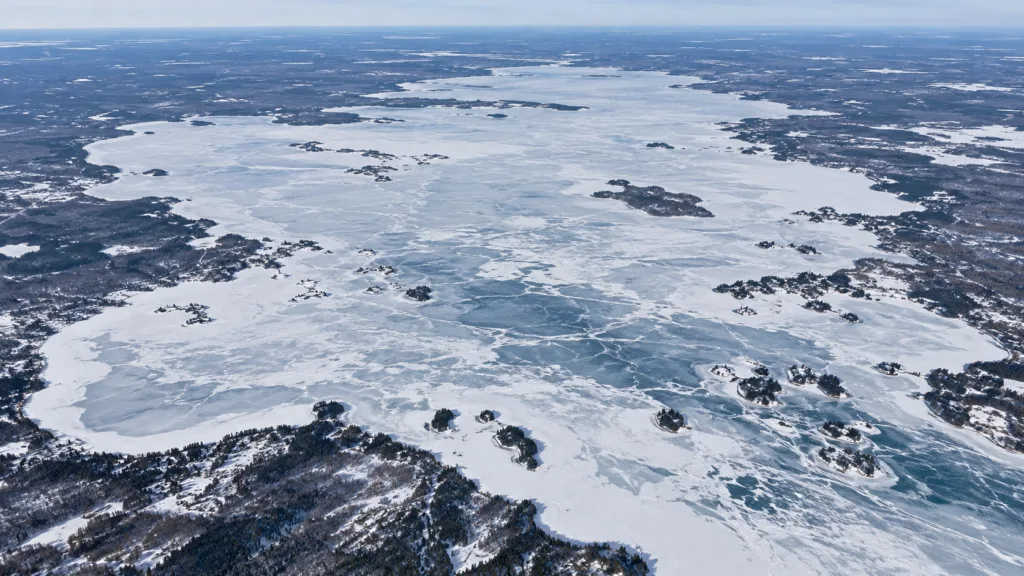
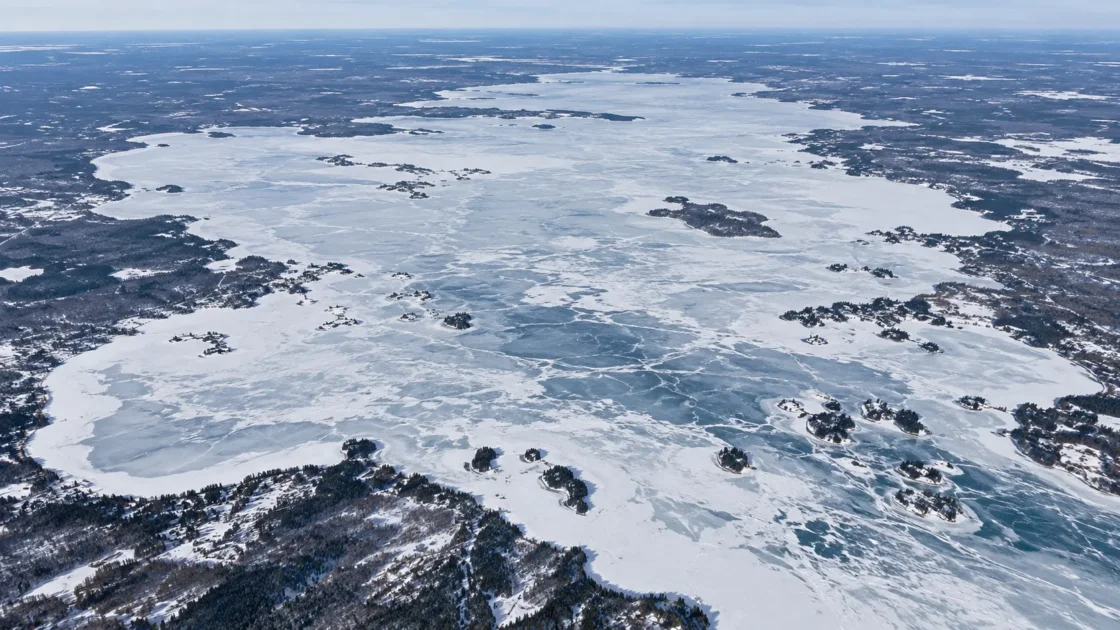
Regular seasonal complete ice cover
Historical Phenology RecordNSIDC — Global Lake and River Ice Phenology Database, Version 1LastLake — Lake Nipissing Ice Phenology SummaryOntario Ministry of Natural Resources — Lake Nipissing Data Review Final ReportEvidence: ModerateMost of Lake Nipissing is shallow, with a mean depth of 4.5 m, while its large surface area and long fetch promote strong mixing before freeze-up; the 52 m maximum depth is confined to a relatively small basin near the French River outlet.
Where Is Lake Nipissing?
Ontario · Canada
Lake Nipissing on the Globe
Rotate the world or focus directly on the lake.
Measured Ice and Freeze Data
Freeze and Ice Cover Through the Year
Month-level states are shown only when supported. Unclassified months remain explicitly marked.
Evidence Behind the Freeze Profile
The historical phenology record uses a complete-cover freeze date rather than the first appearance of local or nearshore ice.
Historical Phenology RecordNSIDC — Global Lake and River Ice Phenology Database, Version 1LastLake — Lake Nipissing Ice Phenology SummaryEvidence: ModerateOntario reports a mean depth of 4.5 m and describes the lake's large surface area, long fetch and shallow bathymetry as supporting thorough mixing; the deepest water is limited to a small basin near the outlet.
Government Lake DataOntario Ministry of Natural Resources — Lake Nipissing Data Review Final ReportEvidence: HighOntario's 1960–2012 review reports ice-out about two weeks earlier in recent decades, while a peer-reviewed 1903–1998 analysis found no statistically significant simple linear trend for Lake Nipissing. The different windows and methods do not support assigning one monotonic long-term rate.
Government Lake Data + Peer ReviewedOntario Ministry of Natural Resources — Lake Nipissing Data Review Final ReportFu et al. (2015) — Trends of Ice Breakup Date in South-Central OntarioEvidence: ModerateThe local record beginning in 1901 lists April 3, 1945 as the earliest whole-lake ice-out and May 19, 1926 as the latest.
Historical Monitoring RecordUpper French River Cottagers Association — Lake Nipissing Ice-Out DatesEvidence: ModerateSources
- NSIDC — Global Lake and River Ice Phenology Database, Version 1
- LastLake — Lake Nipissing Ice Phenology Summary
- Ontario Ministry of Natural Resources — Lake Nipissing Data Review Final Report
- Fu et al. (2015) — Trends of Ice Breakup Date in South-Central Ontario
- Canadian Geographical Names Database — Lake Nipissing
- Upper French River Cottagers Association — Lake Nipissing Ice-Out Dates
Lake Nipissing regularly develops complete seasonal ice cover, but its historical freeze date refers to whole-lake freeze-over rather than the first ice appearing along a shoreline or inside a sheltered bay. The record centers complete closure in early December and complete ice loss in late April, with enough year-to-year variation that neither boundary should be treated as a fixed calendar date.
Why a lake this large can still freeze over completely
Lake Nipissing combines a very large surface area with unusually shallow water across most of its basin. Ontario’s lake assessment gives a mean depth of only 4.5 m. The 52 m maximum occurs in a comparatively small deep basin near the French River outlet rather than representing the lake as a whole.
The same assessment describes the lake’s broad surface, long fetch and shallow bathymetry as supporting thorough mixing. During autumn, wind can keep exposed water mixed while heat is being lost from the water column. Once sustained cold reduces that stored heat sufficiently, the shallow character of most of the basin is compatible with the regular complete freeze-over seen in the historical phenology record. This is a different thermal setting from a large lake dominated by deep water and much greater heat storage.
Freeze-over is not the same event as first ice
The historical Lake Nipissing series is most useful when its definition is kept intact. The freeze date represents complete ice cover, not the first thin ice in a protected shoreline area. Local ice therefore can appear before the recorded whole-lake closure, while wind-exposed water can remain open after quieter sections have already frozen.
The recorded complete freeze-over dates also show how strongly autumn weather can shift the final closure of the lake. Among the winters with freeze dates in the historical series, complete cover has occurred as early as November 14 and as late as December 24. The December median describes the center of that record, not a dependable annual deadline.
A long breakup record does not reduce to one simple trend
Lake Nipissing has an unusually long spring ice record, but different analytical periods produce different trend summaries. Ontario’s review of the 1960–2012 record reports that ice-out was about two weeks earlier in recent decades. That result describes a particular span of the record and a comparison of decadal averages.
A peer-reviewed analysis using Lake Nipissing observations from 1903 to 1998 reached a more complicated result. Its simple linear regression produced a small tendency toward later breakup, but the relationship was not statistically significant. The study also showed that extracted multidecadal behavior depended on the analytical method and the period examined. These records are therefore better read as evidence of substantial long-term variability than as support for one constant rate of earlier or later breakup extending to the present.
What the historical ice dates actually measure
The freeze and breakup series associated with Environment Canada and archived through the Global Lake and River Ice Phenology Database is based on visual observations rather than continuous satellite measurements of ice concentration. The Lake Nipissing observations were read from a weather-station setting, not from the center of every part of the lake.
That makes the record valuable for comparing seasonal timing across many winters, but it is not a daily map of ice distribution. A whole-lake ice-on or ice-off date does not describe differences in ice thickness, short-lived openings, pressure features, or conditions at individual bays and shorelines. Those spatial details require a different type of monitoring than the historical phenology series provides.
Similar Lakes by Freeze Pattern
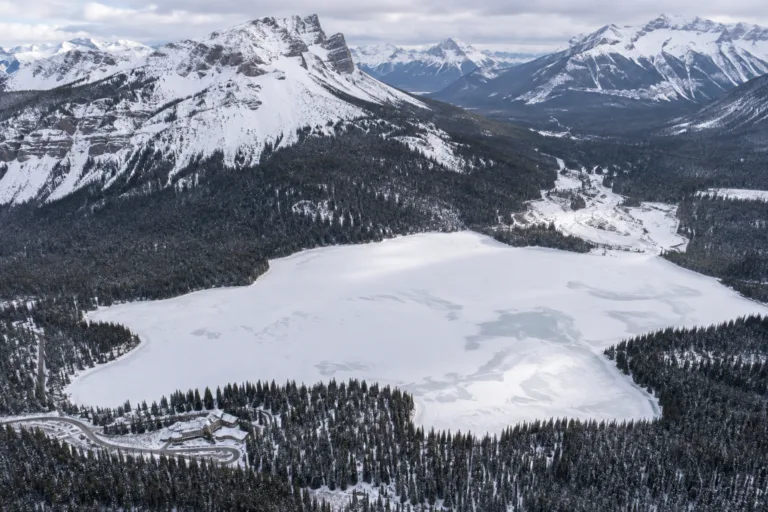
Emerald Lake Freeze
Usually Fully Freezes
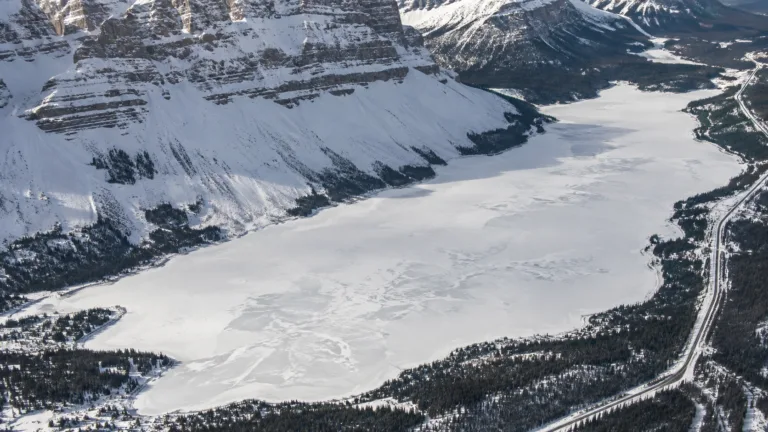
Bow Lake Freeze
Usually Fully Freezes
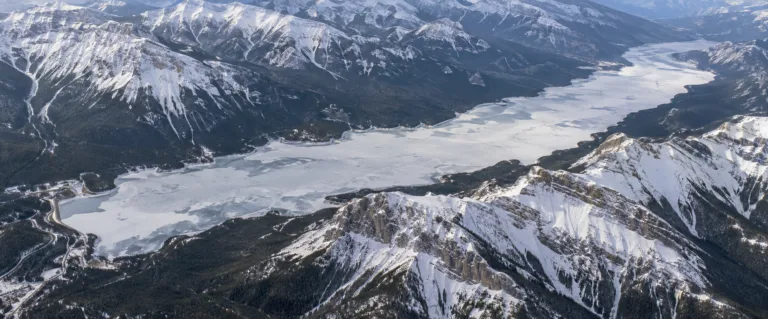
Lake Minnewanka Freeze
Usually Fully Freezes
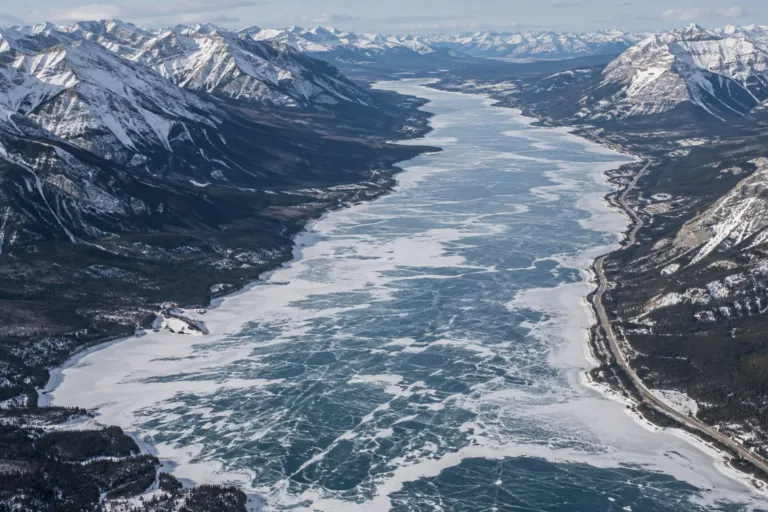
Abraham Lake Freeze
Usually Fully Freezes
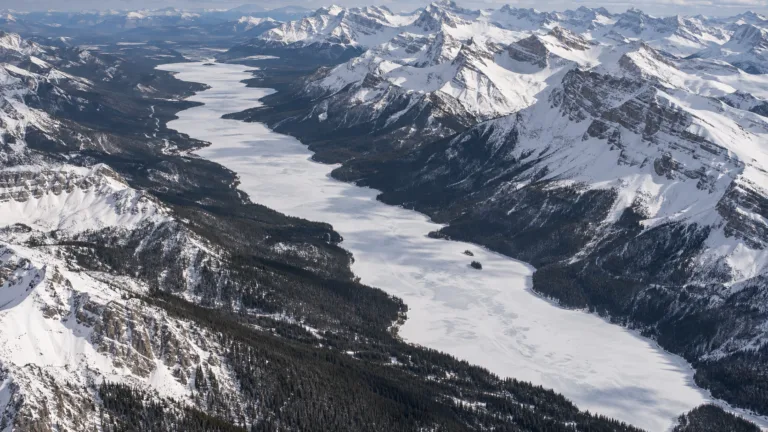
Maligne Lake Freeze
Usually Fully Freezes
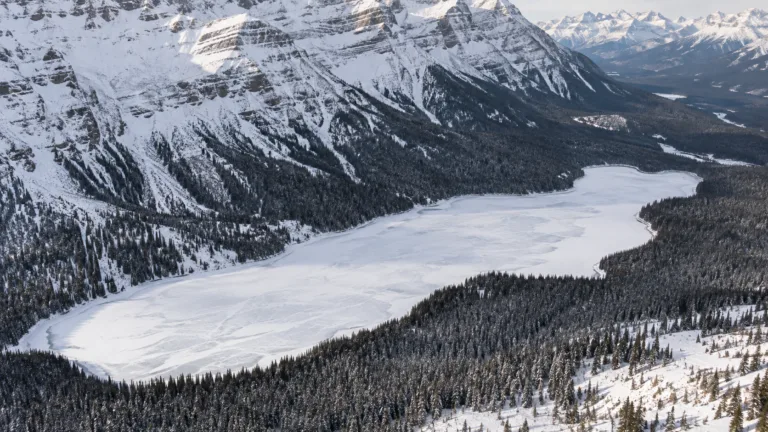
Peyto Lake Freeze
Usually Fully Freezes